Air New Zealand 2013 Annual Report Download - page 41
Download and view the complete annual report
Please find page 41 of the 2013 Air New Zealand annual report below. You can navigate through the pages in the report by either clicking on the pages listed below, or by using the keyword search tool below to find specific information within the annual report.-
 1
1 -
2
-
3
-
4
-
5
-
6
-
7
-
8
-
9
-
10
-
11
-
12
-
13
-
14
-
15
-
16
-
17
-
18
-
19
-
20
-
21
-
22
-
23
-
24
-
25
-
26
-
27
-
28
-
29
-
30
-
 31
31 -
 32
32 -
 33
33 -
 34
34 -
 35
35 -
 36
36 -
 37
37 -
 38
38 -
 39
39 -
 40
40 -
 41
41 -
 42
42 -
 43
43 -
 44
44 -
 45
45 -
 46
46 -
 47
47 -
 48
48 -
 49
49 -
 50
50 -
 51
51 -
52
-
53
-
54
-
55
-
56
-
57
-
58
-
59
-
60
-
61
-
62
-
63
-
64
-
65
-
66
-
67
-
68
-
69
-
70
-
71
-
72
-
73
-
74
-
75
-
76
-
77
-
78
-
79
-
80
 |
 |

Air New Zealand Annual Financial Results 39
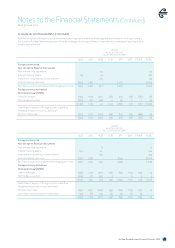
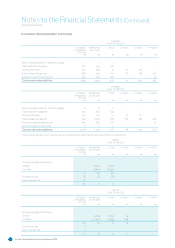
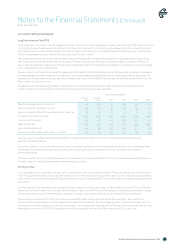
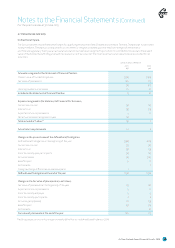
. DEFERRED TAXATION
Deferred tax assets and liabilities are aributable to the following:
NONAIRCRAFT
ASSETS
M
AIRCRAFT
RELATED
M
PROVISIONS
AND
ACCRUALS
M
DERIVATIVE
FINANCIAL
INSTRUMENTS
M
UNUSED TAX
LOSSES
M
TA X R ATE
CHANGE*
M
TOTAL
M
GROUP
As at 1 July 2011
30 323 (81) (26) - (15) 231
Amounts recognised in equity
- - - 37 - - 37
Amounts recognised in earnings
(5) 23 9 - (13) 15 29
As at 30 June 2012
25 346 (72) 11 (13) - 297
Amounts recognised in equity
- - - 19 - - 19
Reclassified to Income Taxation
- - - - 13 - 13
Amounts recognised in earnings
(2) (12) (5) - - - (19)
As at 30 June 2013
23 334 (77) 30 - - 310
COMPANY
As at 1 July 2011
24 225 (79) (29) - (8) 133
Amounts recognised in equity
- - - 38 - - 38
Amounts recognised in earnings
(3) 19 8 - (13) 8 19
As at 30 June 2012
21 244 (71) 9 (13) - 190
Amounts recognised in equity
- - - 20 - - 20
Reclassified to Income Taxation
- - - - 13 - 13
Amounts recognised in earnings
- (21) (2) - - - (23)
As at 30 June 2013
21 223 (73) 29 - - 200
* The New Zealand corporate income tax rate reduced from 30% to 28% at the commencement of the 2012 income year.
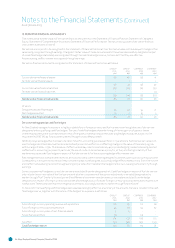
Deferred tax assets and liabilities are offset on the face of the Statement of Financial Position where they relate to entities within the
same taxation authority.
Unused tax losses of Nil (30 June 2012: $48 million) are available to carry forward against future taxable profits. Tax losses from the 2012
financial year have been reclassified to “Income Taxation” to reflect that they will be fully utilised in the current year.
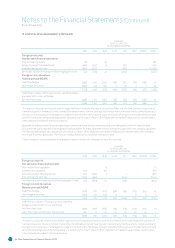
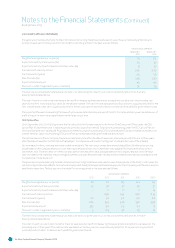
. ISSUED CAPITAL
GROUP
M
GROUP
M
COMPANY
M
COMPANY
M
Authorised, Issued and Fully Paid in Capital
Ordinary Shares
Balance at the beginning of the year 2,282 2,269 2,290 2,277
Shares issued 1 8 1 8
Acquisition of treasury stock (share buyback) (11) - (11) -
Equity-seled share-based payments 5 5 5 5
Balance at the end of the year 2,277 2,282 2,285 2,290
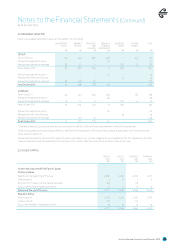
Represented by:
Paid in capital 2,273 2,267 2,281 2,275
Treasury stock (11) - (11) -
Equity-seled share-based payments 15 15 15 15
2,277 2,282 2,285 2,290
Notes to the Financial Statements (Continued)
As at 30 June 2013