Air New Zealand 2013 Annual Report Download - page 58
Download and view the complete annual report
Please find page 58 of the 2013 Air New Zealand annual report below. You can navigate through the pages in the report by either clicking on the pages listed below, or by using the keyword search tool below to find specific information within the annual report.-
 1
1 -
2
-
3
-
4
-
5
-
6
-
7
-
8
-
9
-
10
-
11
-
12
-
13
-
14
-
15
-
16
-
17
-
18
-
19
-
20
-
21
-
22
-
23
-
24
-
25
-
26
-
27
-
28
-
29
-
30
-
31
-
32
-
33
-
34
-
35
-
36
-
37
-
38
-
39
-
40
-
41
-
42
-
43
-
44
-
45
-
46
-
47
-
 48
48 -
 49
49 -
 50
50 -
 51
51 -
 52
52 -
 53
53 -
 54
54 -
 55
55 -
 56
56 -
 57
57 -
 58
58 -
 59
59 -
 60
60 -
 61
61 -
 62
62 -
 63
63 -
 64
64 -
 65
65 -
 66
66 -
 67
67 -
 68
68 -
69
-
70
-
71
-
72
-
73
-
74
-
75
-
76
-
77
-
78
-
79
-
80
 |
 |

Air New Zealand Annual Financial Results
56
M
M
M
M
M
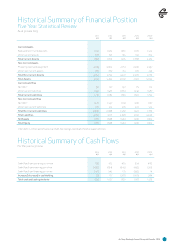
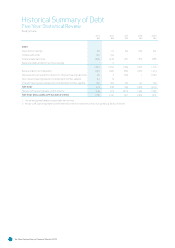
DEBT
Secured borrowings 84 97 154 263 391
Unsecured bonds 150 150 - - -
Finance lease liabilities 1,395 1,445 1,101 812 888
Bank overdra and short term borrowings - 2 - - -
1,629 1,694 1,255 1,075 1,279
Bank and short term deposits 1,150 1,029 860 1,067 1,573
Net open derivatives held in relation to interest-bearing liabilities1 28 4 (28) 1 (100)
Non interest-bearing deposit (included within Other assets) 44 13 - - -
Interest-bearing secured deposit (included within Other assets) 184 180 170 137 130
NET DEBT 223 468 253 (130) (324)
Net aircra operating lease commitments2 945 973 1,064 1,533 1,638
NET DEBT (INCLUDING OFF BALANCE SHEET) 1,168 1,441 1,317 1,403 1,314
1. Unrealised gains/losses on open debt derivatives
2. Net aircra operating lease commitments for the next twelve months, multiplied by a factor of seven
Historical Summary of Debt
Five Year Statistical Review
As at 30 June