Air New Zealand 2013 Annual Report Download - page 57
Download and view the complete annual report
Please find page 57 of the 2013 Air New Zealand annual report below. You can navigate through the pages in the report by either clicking on the pages listed below, or by using the keyword search tool below to find specific information within the annual report.-
 1
1 -
2
-
3
-
4
-
5
-
6
-
7
-
8
-
9
-
10
-
11
-
12
-
13
-
14
-
15
-
16
-
17
-
18
-
19
-
20
-
21
-
22
-
23
-
24
-
25
-
26
-
27
-
28
-
29
-
30
-
31
-
32
-
33
-
34
-
35
-
36
-
37
-
38
-
39
-
40
-
41
-
42
-
43
-
44
-
45
-
46
-
 47
47 -
 48
48 -
 49
49 -
 50
50 -
 51
51 -
 52
52 -
 53
53 -
 54
54 -
 55
55 -
 56
56 -
 57
57 -
 58
58 -
 59
59 -
 60
60 -
 61
61 -
 62
62 -
 63
63 -
 64
64 -
 65
65 -
 66
66 -
 67
67 -
68
-
69
-
70
-
71
-
72
-
73
-
74
-
75
-
76
-
77
-
78
-
79
-
80
 |
 |

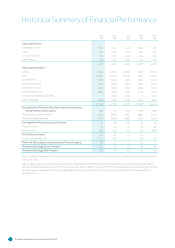
Air New Zealand Annual Financial Results 55
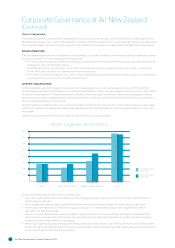
PASSENGERS CARRIED (000)
Domestic 8,694 8,500 8,530 8,018 7,815
International
Australia and Pacific Islands 3,181 3,073 2,965 2,700 2,824
Asia and Europe 596 652 662 668 778
North America and Europe 940 897 946 938 951
Total 4,717 4,622 4,573 4,306 4,553
Total Group 13,411 13,122 13,103 12,324 12,368
AVAILABLE SEAT KILOMETRES (m)
Domestic 5,108 4,969 4,904 4,724 4,783
International
Australia and Pacific Islands 10,277 9,694 9,345 8,804 9,769
Asia and Europe 6,780 7,495 7,432 7,557 8,780
North America and Europe 11,002 10,460 10,672 10,493 10,984
Total 28,059 27,649 27,449 26,854 29,533
Total Group 33,167 32,618 32,353 31,578 34,316
REVENUE PASSENGER KILOMETRES (m)
Domestic 4,218 4,050 4,021 3,733 3,586
International
Australia and Pacific Islands 8,580 8,164 7,799 7,086 7,398
Asia and Europe 5,418 5,979 6,077 6,095 7,016
North America and Europe 9,517 8,820 9,099 8,915 9,112
Total 23,515 22,963 22,975 22,096 23,526
Total Group 27,733 27,013 26,996 25,829 27,112
PASSENGER LOAD FACTOR (%)
Domestic 82.6 81.5 82.0 79.0 75.0
International
Australia and Pacific Islands 83.5 84.2 83.5 80.5 75.7
Asia and Europe 79.9 79.8 81.8 80.7 79.9
North America and Europe 86.5 84.3 85.3 85.0 83.0
Total 83.8 83.1 83.7 82.3 79.7
Total Group 83.6 82.8 83.4 81.8 79.0
GROUP EMPLOYEE NUMBERS (Full Time Equivalents) 10,336 10,453 10,861 10,499 10,726
New Zealand, Australia and Pacific Islands represent short haul operations. Asia, North America and Europe represent long haul operations.
Certain comparatives within the key operating statistics have been reclassified for comparative purposes, to ensure consistency with the
current year.
Key Operating Statistics
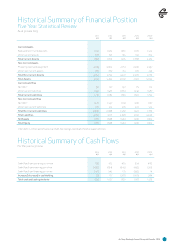
Five Year Statistical Review
For the year to 30 June