Air New Zealand 2013 Annual Report Download - page 23
Download and view the complete annual report
Please find page 23 of the 2013 Air New Zealand annual report below. You can navigate through the pages in the report by either clicking on the pages listed below, or by using the keyword search tool below to find specific information within the annual report.-
 1
1 -
2
-
3
-
4
-
5
-
6
-
7
-
8
-
9
-
10
-
11
-
12
-
 13
13 -
 14
14 -
 15
15 -
 16
16 -
 17
17 -
 18
18 -
 19
19 -
 20
20 -
 21
21 -
 22
22 -
 23
23 -
 24
24 -
 25
25 -
 26
26 -
 27
27 -
 28
28 -
 29
29 -
 30
30 -
 31
31 -
 32
32 -
 33
33 -
34
-
35
-
36
-
37
-
38
-
39
-
40
-
41
-
42
-
43
-
44
-
45
-
46
-
47
-
48
-
49
-
50
-
51
-
52
-
53
-
54
-
55
-
56
-
57
-
58
-
59
-
60
-
61
-
62
-
63
-
64
-
65
-
66
-
67
-
68
-
69
-
70
-
71
-
72
-
73
-
74
-
75
-
76
-
77
-
78
-
79
-
80
 |
 |
Air New Zealand Annual Financial Results 21
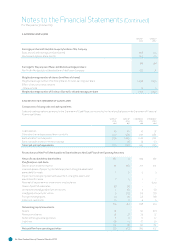
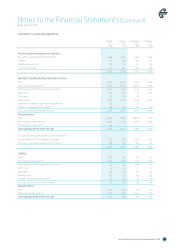
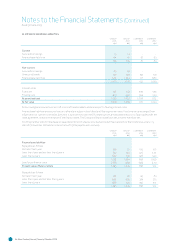
. PROPERTY, PLANT AND EQUIPMENT
GROUP
M
GROUP
M
COMPANY
M
COMPANY
M
Property, plant and equipment comprises:
Aircra, spare engines and simulators 2,488 2,606 1,392 1,543
Spares
116 128 90 104
Plant and equipment 114 126 99 108
Land and buildings 217 232 201 213
2,935 3,092 1,782 1,968
AIRCRAFT, SPARE ENGINES AND SIMULATORS
Cost 3,822 3,328 2,112 1,608
Accumulated depreciation (1,216) (1,100) (569) (517)
Carrying value at the beginning of the year 2,606 2,228 1,543 1,091
Additions 220 665 51 622
Disposals (6) (6) (1) -
Depreciation (319) (270) (194) (162)
Impairment losses recognised during the year (5) - (1) -
Transfer to assets held for resale (8) (11) (6) (8)
Carrying value at the end of the year 2,488 2,606 1,392 1,543
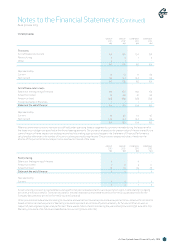
Represented by:
Cost
3,932 3,822 2,098 2,112
Accumulated depreciation (1,439) (1,216) (706) (569)
Provision for impairment (5) - - -
Carrying value at the end of the year 2,488 2,606 1,392 1,543
Aircra, spare engines and simulators comprise:
Finance leased aircra and spare engines 1,765 1,769 1,235 1,322
Owned aircra, spare engines and simulators 723 837 157 221
2,488 2,606 1,392 1,543
SPARES
Cost 264 265 219 222
Accumulated depreciation
(136) (129) (115) (110)
Carrying value at the beginning of the year 128 136 104 112
Additions 13 14 7 10
Disposals (5) (6) (4) (4)
Depreciation
(19) (15) (16) (13)
Transfer to assets held for resale
(1) (1) (1) (1)
Carrying value at the end of the year 116 128 90 104
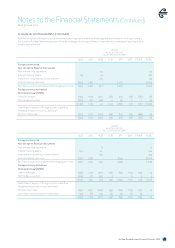
Represented by:
Cost 263 264 214 219
Accumulated depreciation (147) (136) (124) (115)
Carrying value at the end of the year
116 128 90 104
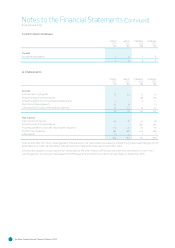
Notes to the Financial Statements (Continued)
As at 30 June 2013