Air New Zealand 2013 Annual Report Download - page 21
Download and view the complete annual report
Please find page 21 of the 2013 Air New Zealand annual report below. You can navigate through the pages in the report by either clicking on the pages listed below, or by using the keyword search tool below to find specific information within the annual report.-
 1
1 -
2
-
3
-
4
-
5
-
6
-
7
-
8
-
9
-
10
-
 11
11 -
 12
12 -
 13
13 -
 14
14 -
 15
15 -
 16
16 -
 17
17 -
 18
18 -
 19
19 -
 20
20 -
 21
21 -
 22
22 -
 23
23 -
 24
24 -
 25
25 -
 26
26 -
 27
27 -
 28
28 -
 29
29 -
 30
30 -
 31
31 -
32
-
33
-
34
-
35
-
36
-
37
-
38
-
39
-
40
-
41
-
42
-
43
-
44
-
45
-
46
-
47
-
48
-
49
-
50
-
51
-
52
-
53
-
54
-
55
-
56
-
57
-
58
-
59
-
60
-
61
-
62
-
63
-
64
-
65
-
66
-
67
-
68
-
69
-
70
-
71
-
72
-
73
-
74
-
75
-
76
-
77
-
78
-
79
-
80
 |
 |

Air New Zealand Annual Financial Results 19
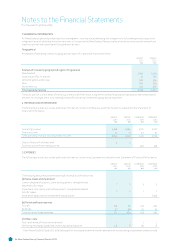
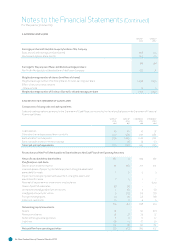
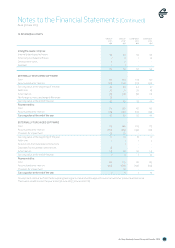
. TRADE AND OTHER RECEIVABLES
GROUP
M
GROUP
M
COMPANY
M
COMPANY
M
Current
Trade receivables 305 308 276 290
Other receivables 3 4 3 4
Less: allowance for doubtful debts (2) (2) (1) (2)
306 310 278 292
Prepayments 44 64 24 43
350 374 302 335
Non-current
Prepayments 49 48 12 7
49 48 12 7
Trade and other receivables is represented by:
Current 277 281 258 268
Past due 1- 90 days 27 23 18 19
Past due greater than 90 days 4 8 3 7
Allowance for doubtful debts
(2) (2) (1) (2)
306 310 278 292
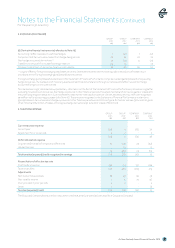
. INVENTORIES
GROUP
M
GROUP
M
COMPANY
M
COMPANY
M
Engineering expendables 132 142 108 118
Consumable stores 23 28 17 23
155 170 125 141
Held at cost 134 150 104 120
Held at fair value less costs to sell
21 20 21 21
155 170 125 141
Movement in the provision for inventory obsolescence
Balance at the beginning of the year (27) (26) (26) (23)
Net increase in provision (11) (1) (11) (3)
Balance at the end of the year (38) (27) (37) (26)
Notes to the Financial Statements (Continued)
For the year to 30 June 2013