Air New Zealand 2013 Annual Report Download - page 18
Download and view the complete annual report
Please find page 18 of the 2013 Air New Zealand annual report below. You can navigate through the pages in the report by either clicking on the pages listed below, or by using the keyword search tool below to find specific information within the annual report.-
 1
1 -
2
-
3
-
4
-
5
-
6
-
7
-
 8
8 -
 9
9 -
 10
10 -
 11
11 -
 12
12 -
 13
13 -
 14
14 -
 15
15 -
 16
16 -
 17
17 -
 18
18 -
 19
19 -
 20
20 -
 21
21 -
 22
22 -
 23
23 -
 24
24 -
 25
25 -
 26
26 -
 27
27 -
 28
28 -
29
-
30
-
31
-
32
-
33
-
34
-
35
-
36
-
37
-
38
-
39
-
40
-
41
-
42
-
43
-
44
-
45
-
46
-
47
-
48
-
49
-
50
-
51
-
52
-
53
-
54
-
55
-
56
-
57
-
58
-
59
-
60
-
61
-
62
-
63
-
64
-
65
-
66
-
67
-
68
-
69
-
70
-
71
-
72
-
73
-
74
-
75
-
76
-
77
-
78
-
79
-
80
 |
 |

Air New Zealand Annual Financial Results
16
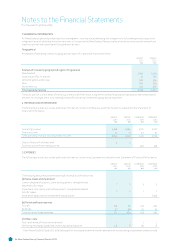
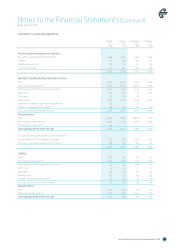
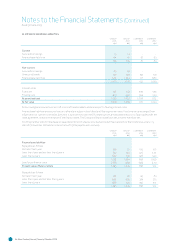
. SEGMENTAL INFORMATION
Air New Zealand operates predominantly in one segment, its primary business being the transportation of passengers and cargo on an
integrated network of scheduled airline services to, from and within New Zealand. Resource allocation decisions across the network are
made to optimise the consolidated Group’s financial result.
Geographical
An analysis of operating revenue by geographical region of original sale is provided below.
GROUP
M
GROUP
M
Analysis of revenue by geographical region of original sale
New Zealand
2,659 2,593
Australia and Pacific Islands 711 677
United Kingdom and Europe
306 363
Asia
366 363
North America
576 487
Total operating revenue
4,618 4,483
The principal non-current asset of the Group is the aircra fleet which is registered in New Zealand and employed across the worldwide
network. Accordingly, there is no reasonable basis for allocating the assets to geographical segments.
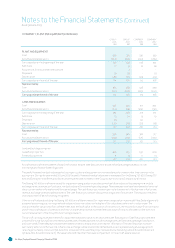
2. REVENUE AND OTHER INCOME
The following disclosure provides additional information in relation to Revenue and Other Income included within the Statement of
Financial Performance.
GROUP
M
GROUP
M
COMPANY
M
COMPANY
M
Operating revenue
4,618 4,483 4,221 4,027
Finance income
37 31 40 36
Total operating revenue, including finance income
4,655 4,514 4,261 4,063
Share of the profit of associates 5 6 - -
Dividend income from related parties
- - 248 198
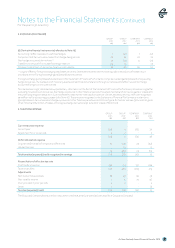
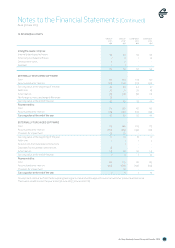
. EXPENSES
The following disclosure provides additional information in relation to Expenses included within the Statement of Financial Performance.
GROUP
M
GROUP
M
COMPANY
M
COMPANY
M
The following amounts have been debited/(credited) in profit before tax:
(a) Gains, losses and impairment
Loss on disposal of property, plant and equipment, intangibles and
assets held for resale 7 6 5 3
Impairment on property, plant and equipment, intangibles and assets
held for resale
7 5 1 7
Reversal of impairment on investments in subsidiaries
- - - (129)
(b) Rental and lease expenses
Aircra 130 161 219 250
Buildings
47 48 39 39
Total rental and lease expenses
177 209 258 289
(c) Other costs
Audit and review of financial statements*
1 1 1 1
Net foreign exchange (gain)/loss on working capital balances
(4) 8 (5) 8
* Other fees of $20k (30 June 2012: $63k) were paid for tax compliance work and other assurance services (relating to business process controls).
Notes to the Financial Statements
For the year to 30 June 2013