Air New Zealand 2013 Annual Report Download - page 25
Download and view the complete annual report
Please find page 25 of the 2013 Air New Zealand annual report below. You can navigate through the pages in the report by either clicking on the pages listed below, or by using the keyword search tool below to find specific information within the annual report.-
 1
1 -
2
-
3
-
4
-
5
-
6
-
7
-
8
-
9
-
10
-
11
-
12
-
13
-
14
-
 15
15 -
 16
16 -
 17
17 -
 18
18 -
 19
19 -
 20
20 -
 21
21 -
 22
22 -
 23
23 -
 24
24 -
 25
25 -
 26
26 -
 27
27 -
 28
28 -
 29
29 -
 30
30 -
 31
31 -
 32
32 -
 33
33 -
 34
34 -
 35
35 -
36
-
37
-
38
-
39
-
40
-
41
-
42
-
43
-
44
-
45
-
46
-
47
-
48
-
49
-
50
-
51
-
52
-
53
-
54
-
55
-
56
-
57
-
58
-
59
-
60
-
61
-
62
-
63
-
64
-
65
-
66
-
67
-
68
-
69
-
70
-
71
-
72
-
73
-
74
-
75
-
76
-
77
-
78
-
79
-
80
 |
 |

Air New Zealand Annual Financial Results 23
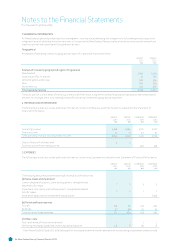
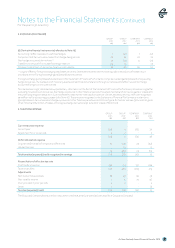
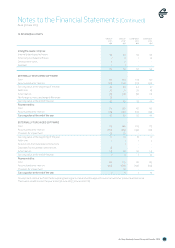
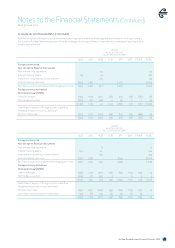
. INTANGIBLE ASSETS
GROUP
M
GROUP
M
COMPANY
M
COMPANY
M
Intangible assets comprise:
Internally developed soware 59 49 55 44
Externally purchased soware 7 11 7 10
Development costs 2 2 - -
Goodwill 1 1 - -
69 63 62 54
INTERNALLY DEVELOPED SOFTWARE
Cost 150 134 143 127
Accumulated amortisation (101) (94) (99) (90)
Carrying value at the beginning of the year
49 40 44 37
Additions 26 21 26 18
Amortisation (15) (12) (15) (11)
Net foreign currency exchange differences (1) - - -
Carrying value at the end of the year 59 49 55 44
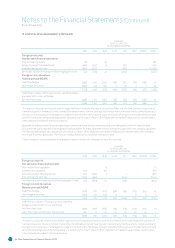
Represented by:
Cost 174 150 167 143
Accumulated amortisation (115) (101) (112) (99)
Carrying value at the end of the year 59 49 55 44
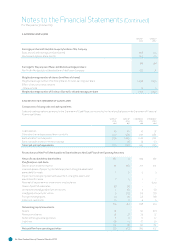
EXTERNALLY PURCHASED SOFTWARE
Cost 173 180 165 173
Accumulated amortisation (160) (165) (155) (161)
Provision for impairment (2) (2) - -
Carrying value at the beginning of the year 11 13 10 12
Additions 1 1 1 2
Acquisitions from business combinations
- 1 - -
Disposals from business combinations (1) - - -
Amortisation (4) (4) (4) (4)
Carrying value at the end of the year 7 11 7 10
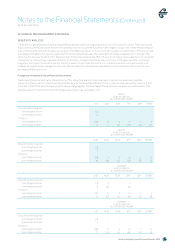
Represented by:
Cost 166 173 161 165
Accumulated amortisation (159) (160) (154) (155)
Provision for impairment - (2) - -
Carrying value at the end of the year 7 11 7 10
Development costs arise from the Group’s engineering activities and will be applied to external customer products and services.
There were no additions in the year ended 30 June 2013 (30 June 2012: Nil).
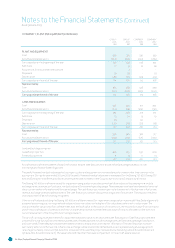
Notes to the Financial Statements (Continued)
As at 30 June 2013