Air New Zealand 2013 Annual Report Download - page 55
Download and view the complete annual report
Please find page 55 of the 2013 Air New Zealand annual report below. You can navigate through the pages in the report by either clicking on the pages listed below, or by using the keyword search tool below to find specific information within the annual report.-
 1
1 -
2
-
3
-
4
-
5
-
6
-
7
-
8
-
9
-
10
-
11
-
12
-
13
-
14
-
15
-
16
-
17
-
18
-
19
-
20
-
21
-
22
-
23
-
24
-
25
-
26
-
27
-
28
-
29
-
30
-
31
-
32
-
33
-
34
-
35
-
36
-
37
-
38
-
39
-
40
-
41
-
42
-
43
-
44
-
 45
45 -
 46
46 -
 47
47 -
 48
48 -
 49
49 -
 50
50 -
 51
51 -
 52
52 -
 53
53 -
 54
54 -
 55
55 -
 56
56 -
 57
57 -
 58
58 -
 59
59 -
 60
60 -
 61
61 -
 62
62 -
 63
63 -
 64
64 -
 65
65 -
66
-
67
-
68
-
69
-
70
-
71
-
72
-
73
-
74
-
75
-
76
-
77
-
78
-
79
-
80
 |
 |

Air New Zealand Annual Financial Results 53
M
M
M
M
M
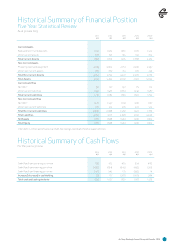
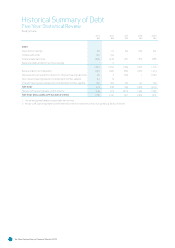
Current Assets
Bank and short term deposits 1,150 1,029 860 1,067 1,573
Other current assets 708 671 615 621 702
Total Current Assets 1,858 1,700 1,475 1,688 2,275
Non-Current Assets
Property, plant and equipment 2,935 3,092 2,714 2,230 2,337
Other non-current assets 819 667 713 679 433
Total Non-Current Assets 3,754 3,759 3,427 2,909 2,770
Total Assets 5,612 5,459 4,902 4,597 5,045
Current Liabilities
Net debt1 159 157 152 175 172
Other current liabilities 1,551 1,526 1,664 1,432 1,587
Total Current Liabilities 1,710 1,683 1,816 1,607 1,759
Non-Current Liabilities
Net debt1 1,470 1,537 1,103 900 1,107
Other non-current liabilities 616 551 479 524 574
Total Non-Current Liabilities 2,086 2,088 1,582 1,424 1,681
Total Liabilities 3,796 3,771 3,398 3,031 3,440
Net Assets 1,816 1,688 1,504 1,566 1,605
Total Equity 1,816 1,688 1,504 1,566 1,605
1. Net debt is comprised of bank overdra, borrowings, bonds and finance lease liabilities.
Historical Summary of Cash Flows
For the year to 30 June
M
M
M
M
M
Cash flow from operating activities 750 472 466 334 486
Cash flow from investing activities (480) (654) (846) (450) (216)
Cash flow from financing activities (147) 349 173 (390) 14
Increase/(decrease) in cash holding 123 167 (207) (506) 284
Total cash and cash equivalents 1,150 1,027 860 1,067 1,573
Historical Summary of Financial Position
Five Year Statistical Review
As at 30 June 2013