Air New Zealand 2013 Annual Report Download - page 7
Download and view the complete annual report
Please find page 7 of the 2013 Air New Zealand annual report below. You can navigate through the pages in the report by either clicking on the pages listed below, or by using the keyword search tool below to find specific information within the annual report.-
 1
1 -
 2
2 -
 3
3 -
 4
4 -
 5
5 -
 6
6 -
 7
7 -
 8
8 -
 9
9 -
 10
10 -
 11
11 -
 12
12 -
 13
13 -
 14
14 -
 15
15 -
 16
16 -
 17
17 -
 18
18 -
19
-
20
-
21
-
22
-
23
-
24
-
25
-
26
-
27
-
28
-
29
-
30
-
31
-
32
-
33
-
34
-
35
-
36
-
37
-
38
-
39
-
40
-
41
-
42
-
43
-
44
-
45
-
46
-
47
-
48
-
49
-
50
-
51
-
52
-
53
-
54
-
55
-
56
-
57
-
58
-
59
-
60
-
61
-
62
-
63
-
64
-
65
-
66
-
67
-
68
-
69
-
70
-
71
-
72
-
73
-
74
-
75
-
76
-
77
-
78
-
79
-
80
 |
 |
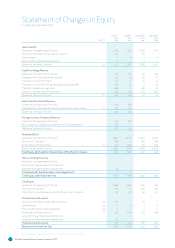
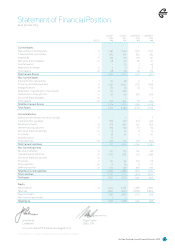
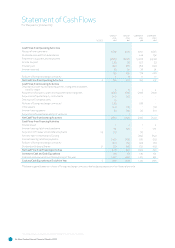
The accompanying accounting policies and notes form part of these financial statements.
Air New Zealand Annual Financial Results 5
NOTES
GROUP
M
GROUP
M
COMPANY
M
COMPANY
M
Current Assets
Bank and short term deposits
6 1,150 1,029 1,146 1,021
Trade and other receivables 7 350 374 302 335
Inventories
8 155 170 125 141
Derivative financial assets
19 98 40 98 41
Income taxation - 20 2 49
Assets held for resale
9 7 9 4 8
Other assets
10 98 58 90 176
Total Current Assets
1,858 1,700 1,767 1,771
Non-Current Assets
Trade and other receivables
7 49 48 12 7
Property, plant and equipment 11 2,935 3,092 1,782 1,968
Intangible assets
12 69 63 62 54
Investment in quoted equity instruments
13 261 203 - -
Investments in other entities 14 46 60 368 408
Derivative financial assets
19 - 1 - 1
Other assets
10 394 292 731 525
Total Non-Current Assets
3,754 3,759 2,955 2,963
Total Assets
5,612 5,459 4,722 4,734
Current Liabilities
Bank overdra and short term borrowings
6 - 2 1 6
Trade and other payables
382 373 347 332
Revenue in advance 15 918 902 910 893
Interest-bearing liabilities
16 159 155 87 83
Derivative financial liabilities
19 13 14 8 15
Provisions 17 15 61 11 60
Income taxation
27 - - -
Other liabilities
20 196 176 661 862
Total Current Liabilities
1,710 1,683 2,025 2,251
Non-Current Liabilities
Revenue in advance
15 140 135 140 134
Interest-bearing liabilities 16 1,470 1,537 921 1,039
Derivative financial liabilities
19 - - - 1
Provisions
17 145 94 144 94
Other liabilities 20 21 25 73 117
Deferred taxation
22 310 297 200 190
Total Non-Current Liabilities
2,086 2,088 1,478 1,575
Total Liabilities
3,796 3,771 3,503 3,826
Net Assets
1,816 1,688 1,219 908
Equity
Issued capital
23 2,277 2,282 2,285 2,290
Reserves
(462) (596) (1,066) (1,382)
Parent interests
1,815 1,686 1,219 908
Non-controlling interests
1 2 - -
Total Equity
1,816 1,688 1,219 908
John Palmer Roger France
CHAIRMAN DIRECTOR
For and on behalf of the Board,29 August 2013
Statement of Financial Position
As at 30 June 2013