2K Sports 2009 Annual Report Download - page 76
Download and view the complete annual report
Please find page 76 of the 2009 2K Sports annual report below. You can navigate through the pages in the report by either clicking on the pages listed below, or by using the keyword search tool below to find specific information within the annual report.-
 1
1 -
2
-
3
-
4
-
5
-
6
-
7
-
8
-
9
-
10
-
11
-
12
-
13
-
14
-
15
-
16
-
17
-
18
-
19
-
20
-
21
-
22
-
23
-
24
-
25
-
26
-
27
-
28
-
29
-
30
-
31
-
32
-
33
-
34
-
35
-
36
-
37
-
38
-
39
-
40
-
41
-
42
-
43
-
44
-
45
-
46
-
47
-
48
-
49
-
50
-
51
-
52
-
53
-
54
-
55
-
56
-
57
-
58
-
59
-
60
-
61
-
62
-
63
-
64
-
65
-
 66
66 -
 67
67 -
 68
68 -
 69
69 -
 70
70 -
 71
71 -
 72
72 -
 73
73 -
 74
74 -
 75
75 -
 76
76 -
 77
77 -
 78
78 -
 79
79 -
 80
80 -
 81
81 -
 82
82 -
 83
83 -
 84
84 -
 85
85 -
 86
86 -
87
-
88
-
89
-
90
-
91
-
92
-
93
-
94
-
95
-
96
-
97
-
98
-
99
-
100
-
101
-
102
-
103
-
104
-
105
-
106
-
107
-
108
-
109
-
110
-
111
-
112
-
113
-
114
-
115
-
116
-
117
-
118
-
119
-
120
-
121
 |
 |

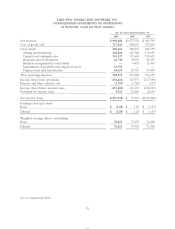
TAKE-TWO INTERACTIVE SOFTWARE, INC.
CONSOLIDATED STATEMENTS OF CASH FLOWS
(in thousands)
For the Years Ended October 31,
2009 2008 2007
Operating activities:
Net income (loss) $(137,930) $ 97,097 $(138,406)
Adjustments to reconcile net income (loss) to net cash provided
by (used for) operating activities:
Amortization and impairment of software development costs
and licenses 105,521 146,102 106,675
Depreciation and amortization 18,623 25,755 27,449
Impairment of goodwill and long-lived assets 14,754 ——
Amortization and impairment of intellectual property 478 2,350 8,626
Stock-based compensation 25,933 40,387 17,329
Deferred income taxes 3,432 (391) (1,718)
Foreign currency transaction loss (gain) and other (3,448) 6,688 2,813
Changes in assets and liabilities, net of effect from purchases of
businesses:
Accounts receivable (41,937) (52,421) 39,159
Inventory 10,239 (4,904) (10,203)
Software development costs and licenses (164,828) (157,076) (160,643)
Prepaid expenses, other current and other non-current assets (519) 16,831 18,270
Deferred revenue (49,829) (5,381) 227
Accounts payable, accrued expenses, income taxes payable and
other liabilities 9,307 36,389 26,377
Total adjustments (72,274) 54,329 74,361
Net cash provided by (used for) operating activities (210,204) 151,426 (64,045)
Investing activities:
Purchase of fixed assets (11,176) (12,277) (21,594)
Cash received from sale of business —3,000 2,778
Payments in connection with business combinations, net of cash
aquired (5,813) (7,503) (5,795)
Net cash used for investing activities (16,989) (16,780) (24,611)
Financing activities:
Proceeds from exercise of employee stock options 22 25,962 9,503
Net borrowings (payments) on line of credit (70,000) 52,000 18,000
Proceeds from issuance of Convertible Notes 138,000 ——
Purchase of convertible note hedges (43,592) ——
Issuance of warrants to purchase common stock 26,342 ——
Payment of debt issuance costs (4,984) (962) (1,809)
Net cash provided by financing activities 45,788 77,000 25,694
Effects of exchange rates on cash and cash equivalents 3,211 (9,126) 8,239
Net increase (decrease) in cash and cash equivalents (178,194) 202,520 (54,723)
Cash and cash equivalents, beginning of year 280,277 77,757 132,480
Cash and cash equivalents, end of year $ 102,083 $ 280,277 $ 77,757
See accompanying Notes.
71