2K Sports 2009 Annual Report Download - page 54
Download and view the complete annual report
Please find page 54 of the 2009 2K Sports annual report below. You can navigate through the pages in the report by either clicking on the pages listed below, or by using the keyword search tool below to find specific information within the annual report.-
 1
1 -
2
-
3
-
4
-
5
-
6
-
7
-
8
-
9
-
10
-
11
-
12
-
13
-
14
-
15
-
16
-
17
-
18
-
19
-
20
-
21
-
22
-
23
-
24
-
25
-
26
-
27
-
28
-
29
-
30
-
31
-
32
-
33
-
34
-
35
-
36
-
37
-
38
-
39
-
40
-
41
-
42
-
43
-
 44
44 -
 45
45 -
 46
46 -
 47
47 -
 48
48 -
 49
49 -
 50
50 -
 51
51 -
 52
52 -
 53
53 -
 54
54 -
 55
55 -
 56
56 -
 57
57 -
 58
58 -
 59
59 -
 60
60 -
 61
61 -
 62
62 -
 63
63 -
 64
64 -
65
-
66
-
67
-
68
-
69
-
70
-
71
-
72
-
73
-
74
-
75
-
76
-
77
-
78
-
79
-
80
-
81
-
82
-
83
-
84
-
85
-
86
-
87
-
88
-
89
-
90
-
91
-
92
-
93
-
94
-
95
-
96
-
97
-
98
-
99
-
100
-
101
-
102
-
103
-
104
-
105
-
106
-
107
-
108
-
109
-
110
-
111
-
112
-
113
-
114
-
115
-
116
-
117
-
118
-
119
-
120
-
121
 |
 |

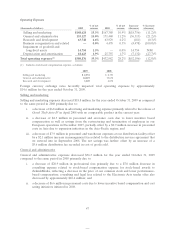
taxable loss required an increase to the valuation allowance of $24.8 million in 2009, while the use of net
operating losses in 2008 enabled the reversal of the valuation allowance of $19.3 million.
As of October 31, 2009, we had gross unrecognized tax benefits, including interest and penalties, of
$24.6 million, all of which would affect our effective tax rate if realized. For the year ended October 31,
2009, gross unrecognized tax benefits decreased by $1.8 million, primarily related to adjustments resulting
from tax audits that concluded during 2009.
U.S. federal taxing authorities have completed examinations of our income tax returns for years through
fiscal 2002. Certain US state taxing authorities are currently examining our income tax returns from fiscal
years 2004 through fiscal 2006. In addition, tax authorities in certain non-U.S. jurisdictions are currently
examining our tax returns. It is possible that tax examinations will be settled prior to October 31, 2010.
Based on the progress and possible settlement of certain audits, we believe it is reasonably possible that
approximately $11.0 million of our gross unrecognized tax benefits could become payable during the next
12 months. We generally are no longer subject to audit for U.S. federal income tax returns for periods prior
to fiscal 2003 and state income tax returns for periods prior to 2004. With some exceptions, we are
generally no longer subject to income tax examinations in non-U.S. jurisdictions for years prior to fiscal
2005.
We are regularly audited by domestic and foreign taxing authorities. Audits may result in tax assessments
in excess of amounts claimed and the payment of additional taxes. We believe that our tax positions comply
with applicable tax law, and that we have adequately provided for reasonably foreseeable tax assessments.
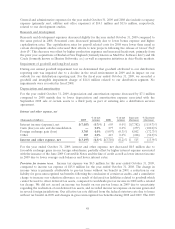
Net (loss) income and earnings (loss) per share. For the year ended October 31, 2009, our net loss was
$137.9 million, compared to net income of $97.1 million in the year ended October 31, 2008. Net loss per
share for the year ended October 31, 2009 was $1.80 compared to net income per share of $1.29 and $1.28
for basic and diluted earnings per share, respectively, for the year ended October 31, 2008. Weighted
average shares outstanding increased compared to the prior period, mainly due to vesting of restricted
stock awards during fiscal 2009.
Years Ended October 31, 2008 and 2007
Publishing
Increase/ % Increase/
(thousands of dollars) 2008 % 2007 % (decrease) (decrease)
Net revenue $1,229,594 100.0% $692,341 100.0% $537,253 77.6%
Product costs 353,263 28.7% 248,744 35.9% 104,519 42.0%
Software development costs and
royalties(1) 169,398 13.8% 136,485 19.7% 32,913 24.1%
Internal royalties 128,772 10.5% 28,892 4.2% 99,880 345.7%
Licenses 56,546 4.6% 58,569 8.5% (2,023) (3.5)%
Cost of goods sold 707,979 57.6% 472,690 68.3% 235,289 49.8%
Gross profit $ 521,615 42.4% $219,651 31.7% $301,964 137.5%
(1) Includes $13,461 and $3,216 of stock-based compensation expense, respectively, included in software development costs and
royalties.
The increase in net revenue primarily reflects higher sales of titles from our Grand Theft Auto franchise
predominantly due to our release of Grand Theft Auto IV in the second quarter of 2008. Total net revenue
generated from our Grand Theft Auto titles was $581.4 million higher in the 2008 period. Our Midnight
Club franchise also contributed $66.7 million to the increase in net revenue in the 2008 period due to the
release of Midnight Club: Los Angeles in October 2008. In addition, we have seen continued success of our
Carnival Games franchise, which debuted in the fourth quarter of 2007 with Carnival Games for the Wii
and increased net revenue by $53.3 million in 2008 and growth in our family-oriented game market with
49