2K Sports 2009 Annual Report Download - page 62
Download and view the complete annual report
Please find page 62 of the 2009 2K Sports annual report below. You can navigate through the pages in the report by either clicking on the pages listed below, or by using the keyword search tool below to find specific information within the annual report.-
 1
1 -
2
-
3
-
4
-
5
-
6
-
7
-
8
-
9
-
10
-
11
-
12
-
13
-
14
-
15
-
16
-
17
-
18
-
19
-
20
-
21
-
22
-
23
-
24
-
25
-
26
-
27
-
28
-
29
-
30
-
31
-
32
-
33
-
34
-
35
-
36
-
37
-
38
-
39
-
40
-
41
-
42
-
43
-
44
-
45
-
46
-
47
-
48
-
49
-
50
-
51
-
 52
52 -
 53
53 -
 54
54 -
 55
55 -
 56
56 -
 57
57 -
 58
58 -
 59
59 -
 60
60 -
 61
61 -
 62
62 -
 63
63 -
 64
64 -
 65
65 -
 66
66 -
 67
67 -
 68
68 -
 69
69 -
 70
70 -
 71
71 -
 72
72 -
73
-
74
-
75
-
76
-
77
-
78
-
79
-
80
-
81
-
82
-
83
-
84
-
85
-
86
-
87
-
88
-
89
-
90
-
91
-
92
-
93
-
94
-
95
-
96
-
97
-
98
-
99
-
100
-
101
-
102
-
103
-
104
-
105
-
106
-
107
-
108
-
109
-
110
-
111
-
112
-
113
-
114
-
115
-
116
-
117
-
118
-
119
-
120
-
121
 |
 |
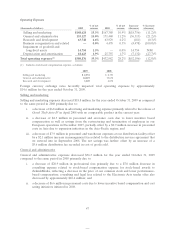
and licenses, primarily consisting of payroll, payments to developers and sports licenses and an increase in
accounts receivable primarily reflecting numerous releases in the fourth quarter of 2009. Cash used in
operating activities was slightly offset by an increase in accounts payable and accruals.
The use of cash for investing activities did not significantly change for the year ended October 31, 2009
compared to the prior period. Cash used for investing activities in fiscal 2009 was $17.0 million mainly due
to the purchase of computer equipment and software and earnout payments made for prior year
acquisitions.
Cash provided by financing activities in 2009 was mainly a result of proceeds received from the issuance of
$138.0 million of Convertible Notes, offset by the pay down of $70.0 million of outstanding borrowings on
our line of credit. In connection with the issuance of the Convertible Notes we paid $5.0 million of debt
issuance costs, purchased $43.6 million of convertible note hedges to offset the dilution of converted shares
and sold $26.3 million of warrants to offset the cost of the note hedge. Also, the lower price of our
common stock compared to the prior year resulted in lower proceeds from the exercise of stock options.
Cash and cash equivalents were positively impacted by $3.2 million in 2009 as a result of foreign currency
exchange movements.
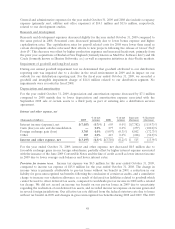
Off-Balance Sheet Arrangements
As of October 31, 2009 and 2008, we did not have any relationships with unconsolidated entities or
financial parties, such as entities often referred to as structured finance or variable interest entities, which
would have been established for the purpose of facilitating off-balance sheet arrangements or other
contractually narrow or limited purposes. As such, we do not have any off-balance sheet arrangements and
are not exposed to any financing, liquidity, market, or credit risk that could arise if we had engaged in such
relationships.
International Operations
Net revenue earned outside of the United States is principally generated by our operations in Europe,
Canada, Australia, and Asia. For 2009 and 2008, approximately 32.5% and 40.7%, respectively, of our net
revenue was earned outside of the United States. We are subject to risks inherent in foreign trade,
including increased credit risks, tariffs and duties, fluctuations in foreign currency exchange rates, shipping
delays and international political, regulatory and economic developments, all of which can have a
significant impact on our operating results.
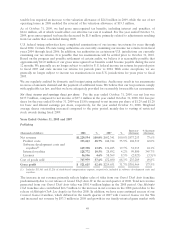
Fluctuations in Quarterly Operating Results and Seasonality
We have experienced fluctuations in quarterly operating results as a result of the timing of the introduction
of new titles; variations in sales of titles developed for particular platforms; market acceptance of our titles;
development and promotional expenses relating to the introduction of new titles; sequels or enhancements
of existing titles; projected and actual changes in platforms; the timing and success of title introductions by
our competitors; product returns; changes in pricing policies by us and our competitors; the accuracy of
retailers’ forecasts of consumer demand; the size and timing of acquisitions; the timing of orders from
major customers; and order cancellations and delays in product shipment. Sales of our titles are also
seasonal, with peak shipments typically occurring in the fourth calendar quarter (our fourth and first fiscal
quarters) as a result of increased demand for titles during the holiday season. Quarterly comparisons of
operating results are not necessarily indicative of future operating results.
57