2K Sports 2009 Annual Report Download - page 34
Download and view the complete annual report
Please find page 34 of the 2009 2K Sports annual report below. You can navigate through the pages in the report by either clicking on the pages listed below, or by using the keyword search tool below to find specific information within the annual report.-
 1
1 -
2
-
3
-
4
-
5
-
6
-
7
-
8
-
9
-
10
-
11
-
12
-
13
-
14
-
15
-
16
-
17
-
18
-
19
-
20
-
21
-
22
-
23
-
 24
24 -
 25
25 -
 26
26 -
 27
27 -
 28
28 -
 29
29 -
 30
30 -
 31
31 -
 32
32 -
 33
33 -
 34
34 -
 35
35 -
 36
36 -
 37
37 -
 38
38 -
 39
39 -
 40
40 -
 41
41 -
 42
42 -
 43
43 -
 44
44 -
45
-
46
-
47
-
48
-
49
-
50
-
51
-
52
-
53
-
54
-
55
-
56
-
57
-
58
-
59
-
60
-
61
-
62
-
63
-
64
-
65
-
66
-
67
-
68
-
69
-
70
-
71
-
72
-
73
-
74
-
75
-
76
-
77
-
78
-
79
-
80
-
81
-
82
-
83
-
84
-
85
-
86
-
87
-
88
-
89
-
90
-
91
-
92
-
93
-
94
-
95
-
96
-
97
-
98
-
99
-
100
-
101
-
102
-
103
-
104
-
105
-
106
-
107
-
108
-
109
-
110
-
111
-
112
-
113
-
114
-
115
-
116
-
117
-
118
-
119
-
120
-
121
 |
 |
15DEC200902125737
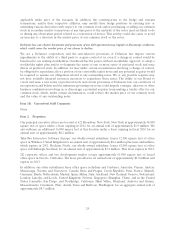
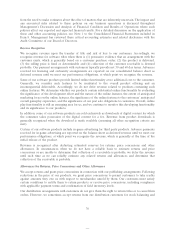
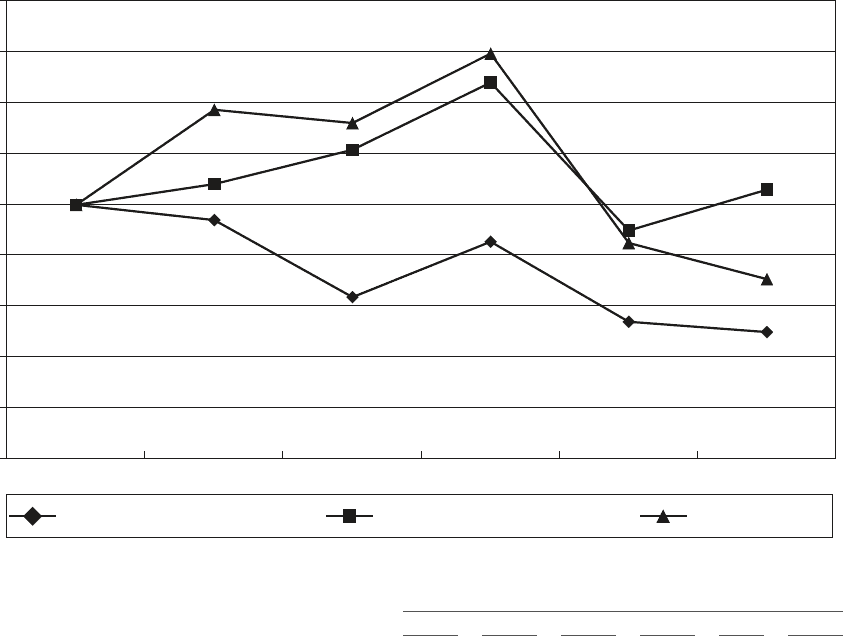
Stock Performance Graph
The following line graph compares, from October 31, 2004 through October 31, 2009, the cumulative total
stockholder return on our common stock with the cumulative total return on the stocks comprising the
NASDAQ Composite Index and the stocks comprising a peer group index consisting of Activision
Blizzard, Inc., Electronic Arts, Inc. and THQ Inc. The comparison assumes $100 was invested on
October 31, 2004 in our common stock and in each of the following indices and assumes reinvestment of all
cash dividends, if any, paid on such securities. We have not paid any cash dividends and, therefore, our
cumulative total return calculation is based solely upon stock price appreciation and not upon
reinvestment of cash dividends. Historical stock price is not necessarily indicative of future stock price
performance.
COMPARISON OF 5 YEAR CUMULATIVE TOTAL RETURN*
Among Take-Two Interactive Software, Inc., The NASDAQ Composite Index and a Peer Group
Comparison of 5 Year Cumulative Total Return
Assumes Initial Investment of $100
October 2009
0.00
20.00
40.00
60.00
80.00
140.00
180.00
160.00
2005 2006 2007 20092008
2004
120.00
100.00
NASDAQ Composite-Total Returns TTWO Peer GroupTake-Two Interactive Software, Inc.
* $100 invested on October 31, 2004 in stock or index-including reinvestment of dividends.
October 31,
2004 2005 2006 2007 2008 2009
Take-Two Interactive Software, Inc 100.00 93.99 63.69 85.49 54.00 49.94
NASDAQ Composite-Total Returns 100.00 108.15 121.64 148.10 89.88 107.94
Peer Group 100.00 137.41 132.17 159.45 84.93 70.74
29