2K Sports 2009 Annual Report Download - page 56
Download and view the complete annual report
Please find page 56 of the 2009 2K Sports annual report below. You can navigate through the pages in the report by either clicking on the pages listed below, or by using the keyword search tool below to find specific information within the annual report.-
 1
1 -
2
-
3
-
4
-
5
-
6
-
7
-
8
-
9
-
10
-
11
-
12
-
13
-
14
-
15
-
16
-
17
-
18
-
19
-
20
-
21
-
22
-
23
-
24
-
25
-
26
-
27
-
28
-
29
-
30
-
31
-
32
-
33
-
34
-
35
-
36
-
37
-
38
-
39
-
40
-
41
-
42
-
43
-
44
-
45
-
 46
46 -
 47
47 -
 48
48 -
 49
49 -
 50
50 -
 51
51 -
 52
52 -
 53
53 -
 54
54 -
 55
55 -
 56
56 -
 57
57 -
 58
58 -
 59
59 -
 60
60 -
 61
61 -
 62
62 -
 63
63 -
 64
64 -
 65
65 -
 66
66 -
67
-
68
-
69
-
70
-
71
-
72
-
73
-
74
-
75
-
76
-
77
-
78
-
79
-
80
-
81
-
82
-
83
-
84
-
85
-
86
-
87
-
88
-
89
-
90
-
91
-
92
-
93
-
94
-
95
-
96
-
97
-
98
-
99
-
100
-
101
-
102
-
103
-
104
-
105
-
106
-
107
-
108
-
109
-
110
-
111
-
112
-
113
-
114
-
115
-
116
-
117
-
118
-
119
-
120
-
121
 |
 |

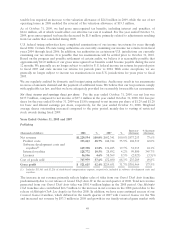
Revenue earned outside of North America accounted for approximately 43.5% of our net revenue in 2008
compared to 34.7% in 2007. This increase was primarily attributable to our simultaneous global release of
Grand Theft Auto IV and Midnight Club: Los Angeles for the PS3 and Xbox 360. Foreign exchange rates
increased revenue by approximately $20.4 million in 2008.
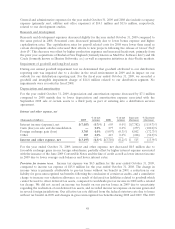
Distribution
Increase/ % Increase/
(thousands of dollars) 2008 % 2007 % (decrease) (decrease)
Net revenue $307,936 100.0% $289,450 100.0% $18,486 6.4%
Cost of goods sold 280,716 91.2% 262,344 90.6% 18,372 7.0%
Gross profit $ 27,220 8.8% $ 27,106 9.4% $ 114 0.4%
Net revenue associated with software for current generation platforms increased $29.5 million and
hardware sales increased $16.8 million, reflecting increased availability of current generation platforms,
especially the Wii. In addition, PC software sales increased $6.8 million. Offsetting the 2008 increases were
lower sales of prior generation software of $19.1 million, reflecting a shift in consumer demand for newer
software. We experienced a decline in software sales for Nintendo handheld devices and peripherals of
$15.9 million.
In September 2008, we agreed to outsource the pick, pack, ship and warehousing functions for our
publishing and distribution businesses. In addition, we sold certain assets of our distribution business,
including warehouse management, processing and value-added service operations of our distribution
facility.
Foreign currency exchange rates increased net revenue by approximately $5.8 million in 2008, as a result of
a stronger Canadian dollar throughout most of 2008 and an increased proportion of international sales.
The decrease in gross margin mainly related to a $3.7 million write-down of inventory in 2008 in
conjunction with our plan to reduce the number of titles that we manage and distribute in order to focus
on higher gross margin products and improve the distribution businesses’ operating efficiency. Excluding
the write-down of inventory, the gross margin would have increased to 10.0% in 2008, primarily due to
increased bundling of software with hardware.
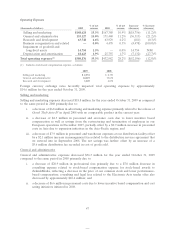
Operating Expenses
% of net % of net Increase/ % Increase/
(thousands of dollars) 2008 revenue 2007 revenue (decrease) (decrease)
Selling and marketing $167,380 10.9% $130,652 13.3% $ 36,728 28.1%
General and administrative 171,440 11.2% 150,432 15.3% 21,008 14.0%
Research and development 63,929 4.2% 48,455 4.9% 15,474 31.9%
Business reorganization and related 4,478 0.3% 17,467 1.8% (12,989) (74.4)%
Depreciation and amortization 25,755 1.7% 27,449 2.8% (1,694) (6.2)%
Total operating expenses(1) $432,982 28.2% $374,455 38.1% $ 58,527 15.6%
(1) Includes stock-based compensation expense, which was allocated as follows:
2008 2007
Selling and marketing $ 2,370 $ 1,232
General and administrative 19,678 7,080
Research and development 4,878 3,735
Business reorganization and related —2,066
51