2K Sports 2009 Annual Report Download - page 108
Download and view the complete annual report
Please find page 108 of the 2009 2K Sports annual report below. You can navigate through the pages in the report by either clicking on the pages listed below, or by using the keyword search tool below to find specific information within the annual report.-
 1
1 -
2
-
3
-
4
-
5
-
6
-
7
-
8
-
9
-
10
-
11
-
12
-
13
-
14
-
15
-
16
-
17
-
18
-
19
-
20
-
21
-
22
-
23
-
24
-
25
-
26
-
27
-
28
-
29
-
30
-
31
-
32
-
33
-
34
-
35
-
36
-
37
-
38
-
39
-
40
-
41
-
42
-
43
-
44
-
45
-
46
-
47
-
48
-
49
-
50
-
51
-
52
-
53
-
54
-
55
-
56
-
57
-
58
-
59
-
60
-
61
-
62
-
63
-
64
-
65
-
66
-
67
-
68
-
69
-
70
-
71
-
72
-
73
-
74
-
75
-
76
-
77
-
78
-
79
-
80
-
81
-
82
-
83
-
84
-
85
-
86
-
87
-
88
-
89
-
90
-
91
-
92
-
93
-
94
-
95
-
96
-
97
-
 98
98 -
 99
99 -
 100
100 -
 101
101 -
 102
102 -
 103
103 -
 104
104 -
 105
105 -
 106
106 -
 107
107 -
 108
108 -
 109
109 -
 110
110 -
 111
111 -
 112
112 -
 113
113 -
 114
114 -
 115
115 -
 116
116 -
 117
117 -
 118
118 -
119
-
120
-
121
 |
 |

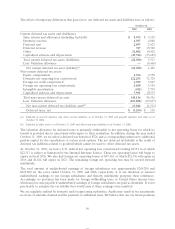
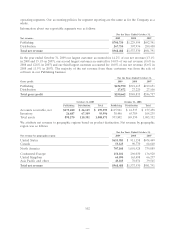
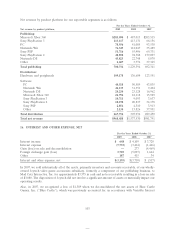
Net revenue by product platform for our reportable segments is as follows:
For the Years Ended October 31,
Net revenue by product platform: 2009 2008 2007
Publishing:
Microsoft Xbox 360 $283,094 $ 487,013 $205,515
Sony PlayStation 3 113,117 413,131 66,156
PC 78,936 41,085 93,538
Nintendo Wii 76,543 112,047 35,489
Sony PSP 51,716 55,406 69,331
Sony PlayStation 2 48,898 94,388 179,097
Nintendo DS 45,823 22,748 5,870
Other 2,607 3,776 37,345
Total publishing 700,734 1,229,594 692,341
Distribution:
Hardware and peripherals 109,178 136,684 123,551
Software:
PC 44,518 50,589 43,835
Nintendo Wii 42,133 31,351 9,494
Nintendo DS 24,234 23,128 16,962
Microsoft Xbox 360 21,794 18,118 15,929
Sony PlayStation 3 10,711 9,093 3,637
Sony PlayStation 2 10,198 20,837 34,178
Sony PSP 2,854 4,310 3,913
Other 2,134 13,826 37,951
Total distribution 267,754 307,936 289,450
Total net revenue $968,488 $1,537,530 $981,791
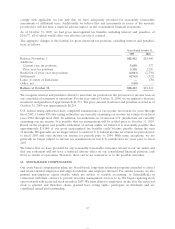
16. INTEREST AND OTHER EXPENSE, NET
For the Years Ended October 31,
2009 2008 2007
Interest income $ 648 $ 4,109 $ 3,720
Interest expense (7,735) (3,414) (1,446)
Gain (loss) on sale and deconsolidation —277 (4,469)
Foreign exchange gain (loss) 3,705 (5,097) 1,644
Other 187 415 34
Interest and other expense, net $(3,195) $(3,710) $ (517)
In 2007, we sold substantially all of the assets, primarily inventory and accounts receivable, of our wholly-
owned Joytech video game accessories subsidiary, formerly a component of our publishing business, to
Mad Catz Interactive, Inc. for approximately $3,575 in cash and notes receivable resulting in a loss on sale
of $3,080. The disposition of Joytech did not involve a significant amount of assets or materially impact our
operating results.
Also, in 2007, we recognized a loss of $1,389 when we deconsolidated the net assets of Blue Castle
Games, Inc. (‘‘Blue Castle’’), which was previously accounted for, in accordance with Variable Interest
103