2K Sports 2009 Annual Report Download - page 107
Download and view the complete annual report
Please find page 107 of the 2009 2K Sports annual report below. You can navigate through the pages in the report by either clicking on the pages listed below, or by using the keyword search tool below to find specific information within the annual report.-
 1
1 -
2
-
3
-
4
-
5
-
6
-
7
-
8
-
9
-
10
-
11
-
12
-
13
-
14
-
15
-
16
-
17
-
18
-
19
-
20
-
21
-
22
-
23
-
24
-
25
-
26
-
27
-
28
-
29
-
30
-
31
-
32
-
33
-
34
-
35
-
36
-
37
-
38
-
39
-
40
-
41
-
42
-
43
-
44
-
45
-
46
-
47
-
48
-
49
-
50
-
51
-
52
-
53
-
54
-
55
-
56
-
57
-
58
-
59
-
60
-
61
-
62
-
63
-
64
-
65
-
66
-
67
-
68
-
69
-
70
-
71
-
72
-
73
-
74
-
75
-
76
-
77
-
78
-
79
-
80
-
81
-
82
-
83
-
84
-
85
-
86
-
87
-
88
-
89
-
90
-
91
-
92
-
93
-
94
-
95
-
96
-
 97
97 -
 98
98 -
 99
99 -
 100
100 -
 101
101 -
 102
102 -
 103
103 -
 104
104 -
 105
105 -
 106
106 -
 107
107 -
 108
108 -
 109
109 -
 110
110 -
 111
111 -
 112
112 -
 113
113 -
 114
114 -
 115
115 -
 116
116 -
 117
117 -
118
-
119
-
120
-
121
 |
 |

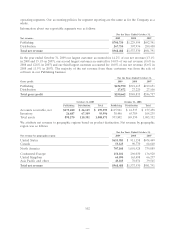
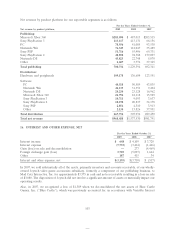
operating segments. Our accounting policies for segment reporting are the same as for the Company as a
whole.
Information about our reportable segments was as follows:
For the Years Ended October 31,
Net revenue: 2009 2008 2007
Publishing $700,734 $1,229,594 $692,341
Distribution 267,754 307,936 289,450
Total net revenue $968,488 $1,537,530 $981,791
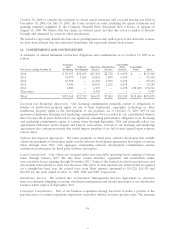
In the year ended October 31, 2009 our largest customer accounted for 14.2% of our net revenue (13.1%
in 2008 and 15.1% in 2007), our second largest customer accounted for 14.0% of our net revenue (9.6% in
2008 and 12.8% in 2007) and our third largest customer accounted for 10.0% of our net revenue (8.6% in
2008 and 11.5% in 2007). The majority of the net revenue from these customers was from the sale of
software in our Publishing business.
For the Years Ended October 31,
Gross profit: 2009 2008 2007
Publishing $232,990 $521,615 $219,651
Distribution 17,672 27,220 27,106
Total gross profit $250,662 $548,835 $246,757
October 31, 2009 October 31, 2008
Publishing Distribution Total Publishing Distribution Total
Accounts receivable, net $173,280 $ 26,115 $ 199,395 $115,921 $ 41,537 $ 157,458
Inventory 26,687 67,309 93,996 38,446 65,789 104,235
Total assets 898,270 110,301 1,008,571 933,802 149,550 1,083,352
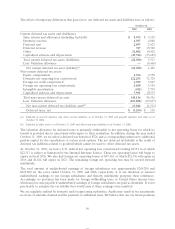
We attribute net revenue to geographic regions based on product destination. Net revenue by geographic
region was as follows:
For the Years Ended October 31,
Net revenue by geographic region: 2009 2008 2007
United States $653,983 $ 911,158 $674,449
Canada 53,125 90,770 64,640
North America 707,108 1,001,928 739,089
Continental Europe 154,101 296,030 136,920
United Kingdom 64,094 163,498 66,237
Asia Pacific and other 43,185 76,074 39,545
Total net revenue $968,488 $1,537,530 $981,791
102