2K Sports 2009 Annual Report Download - page 110
Download and view the complete annual report
Please find page 110 of the 2009 2K Sports annual report below. You can navigate through the pages in the report by either clicking on the pages listed below, or by using the keyword search tool below to find specific information within the annual report.-
 1
1 -
2
-
3
-
4
-
5
-
6
-
7
-
8
-
9
-
10
-
11
-
12
-
13
-
14
-
15
-
16
-
17
-
18
-
19
-
20
-
21
-
22
-
23
-
24
-
25
-
26
-
27
-
28
-
29
-
30
-
31
-
32
-
33
-
34
-
35
-
36
-
37
-
38
-
39
-
40
-
41
-
42
-
43
-
44
-
45
-
46
-
47
-
48
-
49
-
50
-
51
-
52
-
53
-
54
-
55
-
56
-
57
-
58
-
59
-
60
-
61
-
62
-
63
-
64
-
65
-
66
-
67
-
68
-
69
-
70
-
71
-
72
-
73
-
74
-
75
-
76
-
77
-
78
-
79
-
80
-
81
-
82
-
83
-
84
-
85
-
86
-
87
-
88
-
89
-
90
-
91
-
92
-
93
-
94
-
95
-
96
-
97
-
98
-
99
-
 100
100 -
 101
101 -
 102
102 -
 103
103 -
 104
104 -
 105
105 -
 106
106 -
 107
107 -
 108
108 -
 109
109 -
 110
110 -
 111
111 -
 112
112 -
 113
113 -
 114
114 -
 115
115 -
 116
116 -
 117
117 -
 118
118 -
 119
119 -
 120
120 -
121
 |
 |

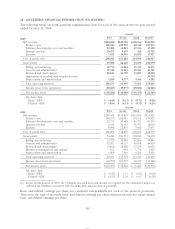
18. QUARTERLY FINANCIAL INFORMATION (UNAUDITED)
The following tables set forth quarterly supplementary data for each of the years in the two-year period
ended October 31, 2009:
Quarter
First Second Third Fourth(1)
2009
Net revenue $256,810 $229,722 $138,564 $343,392
Product costs 149,946 108,995 80,550 147,271
Software development costs and royalties 23,302 28,012 17,156 47,490
Internal royalties 20,472 9,659 368 27,725
Licenses 7,182 14,936 16,835 17,927
Cost of goods sold 200,902 161,602 114,909 240,413
Gross profit 55,908 68,120 23,655 102,979
Selling and marketing 40,774 31,044 25,335 51,471
General and administrative 39,748 31,415 29,583 34,381
Research and development 20,943 14,759 13,887 14,159
Impairment of goodwill and long-lived assets — — — 14,754
Depreciation and amortization 5,108 4,777 4,456 4,282
Total operating expenses 106,573 81,995 73,261 119,047
Income (loss) from operations (50,665) (13,875) (49,606) (16,068)
Net income (loss) $(50,388) $ (10,080) $(55,473) $ (21,989)
Per share data:
Basic—EPS $ (0.66) $ (0.13) $ (0.72) $ (0.28)
Diluted—EPS $ (0.66) $ (0.13) $ (0.72) $ (0.28)
Quarter
First Second Third Fourth
2008
Net revenue $240,442 $539,810 $433,836 $323,442
Product costs 148,152 185,043 154,362 146,422
Software development costs and royalties 22,713 57,688 45,721 43,276
Internal royalties 6,145 52,653 51,971 18,003
Licenses 8,998 22,875 7,602 17,071
Cost of goods sold 186,008 318,259 259,656 224,772
Gross profit 54,434 221,551 174,180 98,670
Selling and marketing 33,729 45,949 42,856 44,846
General and administrative 32,921 48,317 45,678 44,524
Research and development 15,810 14,828 17,239 16,052
Business reorganization and related 162 944 1,771 1,601
Depreciation and amortization 6,409 7,516 6,201 5,629
Total operating expenses 89,031 117,554 113,745 112,652
Income (loss) from operations (34,597) 103,997 60,435 (13,982)
Net income (loss) $(37,997) $ 98,222 $ 51,826 $(14,954)
Per share data:
Basic—EPS $ (0.52) $ 1.31 $ 0.68 $ (0.20)
Diluted—EPS $ (0.52) $ 1.29 $ 0.67 $ (0.20)
(1) In the fourth quarter of 2009, the Company recorded non-cash income tax expense for the cumulative impact of
deferred tax liabilities associated with tax deductible amortization of goodwill.
Basic and diluted earnings per share are computed independently for each of the quarters presented.
Therefore, the sum of quarterly basic and diluted earnings per share information may not equal annual
basic and diluted earnings per share.
105