2K Sports 2009 Annual Report Download - page 35
Download and view the complete annual report
Please find page 35 of the 2009 2K Sports annual report below. You can navigate through the pages in the report by either clicking on the pages listed below, or by using the keyword search tool below to find specific information within the annual report.-
 1
1 -
2
-
3
-
4
-
5
-
6
-
7
-
8
-
9
-
10
-
11
-
12
-
13
-
14
-
15
-
16
-
17
-
18
-
19
-
20
-
21
-
22
-
23
-
24
-
 25
25 -
 26
26 -
 27
27 -
 28
28 -
 29
29 -
 30
30 -
 31
31 -
 32
32 -
 33
33 -
 34
34 -
 35
35 -
 36
36 -
 37
37 -
 38
38 -
 39
39 -
 40
40 -
 41
41 -
 42
42 -
 43
43 -
 44
44 -
 45
45 -
46
-
47
-
48
-
49
-
50
-
51
-
52
-
53
-
54
-
55
-
56
-
57
-
58
-
59
-
60
-
61
-
62
-
63
-
64
-
65
-
66
-
67
-
68
-
69
-
70
-
71
-
72
-
73
-
74
-
75
-
76
-
77
-
78
-
79
-
80
-
81
-
82
-
83
-
84
-
85
-
86
-
87
-
88
-
89
-
90
-
91
-
92
-
93
-
94
-
95
-
96
-
97
-
98
-
99
-
100
-
101
-
102
-
103
-
104
-
105
-
106
-
107
-
108
-
109
-
110
-
111
-
112
-
113
-
114
-
115
-
116
-
117
-
118
-
119
-
120
-
121
 |
 |

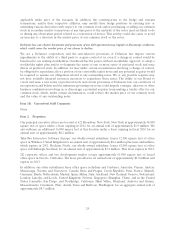
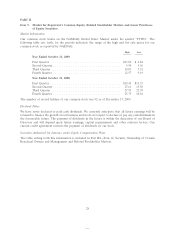
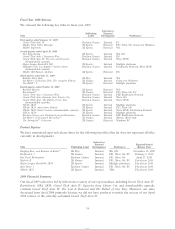
Item 6. Selected Financial Data
The following tables present selected financial data for the five years ended October 31, 2009 (in
thousands, except per share data):
Years Ended October 31,
2009 2008 2007 2006(1) 2005(2)
STATEMENT OF OPERATIONS DATA:
Net revenue $ 968,488 $1,537,530 $ 981,791 $1,037,840 $1,201,220
Cost of goods sold 717,826 988,695 735,034 825,476 786,378
Gross profit 250,662 548,835 246,757 212,364 414,842
Selling and marketing 148,624 167,380 130,652 139,250 156,668
General and administrative 135,127 171,440 150,432 156,191 125,976
Research and development 63,748 63,929 48,455 64,258 73,724
Business reorganization and related —4,478 17,467 — —
Impairment of goodwill and long-lived
assets 14,754 — — 15,608 —
Depreciation and amortization 18,623 25,755 27,449 26,399 22,016
Total operating expenses 380,876 432,982 374,455 401,706 378,384
Income (loss) from operations (130,214) 115,853 (127,698) (189,342) 36,458
Net income (loss) $ (137,930) $ 97,097 $(138,406) $ (184,889) $ 35,314
Earnings (loss) per share:
Basic $ (1.80) $ 1.29 $ (1.93) $ (2.60) $ 0.51
Diluted $ (1.80) $ 1.28 $ (1.93) $ (2.60) $ 0.50
Weighted average shares outstanding:
Basic 76,815 75,039 71,860 71,012 69,859
Diluted 76,815 75,943 71,860 71,012 70,882
As of October 31,
2009 2008 2007 2006 2005
BALANCE SHEET DATA:
Cash and cash equivalents $ 102,083 $ 280,277 $ 77,757 $ 132,480 $ 107,195
Working capital 273,931 358,355 186,362 281,327 365,878
Total assets 1,008,571 1,083,352 831,143 868,806 935,220
Long-term debt 138,000 70,000 18,000 — —
Total liabilities 502,439 468,234 359,989 318,414 249,390
Stockholders’ equity 506,132 615,118 471,154 550,392 685,830
(1) Net income (loss) includes a $63.5 million charge to income tax expense for an increase in our valuation allowance for deferred
tax assets, reflecting uncertain realization of future tax deductions.
(2) We incurred substantial product returns and other costs related to our Grand Theft Auto: San Andreas title, which was
temporarily re-rated ‘‘AO’’ from ‘‘M.’’ The resulting impact on our consolidated results of operations in fiscal 2005 was a
reduction of $24.5 million, $5.9 million, and $18.6 million from net revenue, cost of goods sold and income from operations,
respectively.
30