XM Radio 2014 Annual Report Download - page 94
Download and view the complete annual report
Please find page 94 of the 2014 XM Radio annual report below. You can navigate through the pages in the report by either clicking on the pages listed below, or by using the keyword search tool below to find specific information within the annual report.-
 1
1 -
2
-
3
-
4
-
5
-
6
-
7
-
8
-
9
-
10
-
11
-
12
-
13
-
14
-
15
-
16
-
17
-
18
-
19
-
20
-
21
-
22
-
23
-
24
-
25
-
26
-
27
-
28
-
29
-
30
-
31
-
32
-
33
-
34
-
35
-
36
-
37
-
38
-
39
-
40
-
41
-
42
-
43
-
44
-
45
-
46
-
47
-
48
-
49
-
50
-
51
-
52
-
53
-
54
-
55
-
56
-
57
-
58
-
59
-
60
-
61
-
62
-
63
-
64
-
65
-
66
-
67
-
68
-
69
-
70
-
71
-
72
-
73
-
74
-
75
-
76
-
77
-
78
-
79
-
80
-
81
-
82
-
83
-
 84
84 -
 85
85 -
 86
86 -
 87
87 -
 88
88 -
 89
89 -
 90
90 -
 91
91 -
 92
92 -
 93
93 -
 94
94 -
 95
95 -
 96
96 -
 97
97 -
 98
98 -
 99
99 -
 100
100 -
 101
101 -
 102
102 -
 103
103 -
 104
104 -
105
-
106
-
107
-
108
-
109
-
110
-
111
-
112
-
113
-
114
-
115
-
116
-
117
-
118
-
119
-
120
-
121
-
122
-
123
-
124
-
125
-
126
-
127
-
128
-
129
-
130
-
131
-
132
-
133
-
134
-
135
-
136
-
137
-
138
-
139
-
140
-
141
-
142
-
143
-
144
-
145
-
146
-
147
-
148
-
149
 |
 |
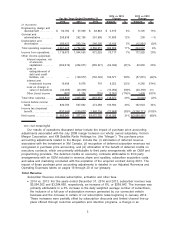
was primarily driven by higher subscriber growth compared to spend for agent staffing and
training.
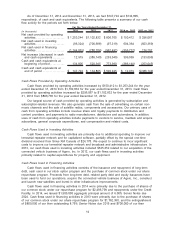
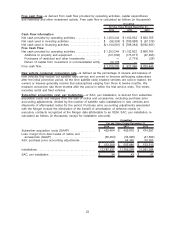
Free Cash Flow includes the net cash provided by operations, additions to property and
equipment, and restricted and other investment activity. (For a reconciliation to GAAP see the
accompanying glossary on pages 18 through 22 for more details.)
•2014 vs. 2013: For the years ended December 31, 2014 and 2013, free cash flow was
$1,155,776 and $927,496, respectively, an increase of $228,280. The increase was primarily
driven by higher net cash provided by operating activities from improved performance,
collections from subscribers and distributors, the absence of satellite construction related
payments and dividends received from Sirius XM Canada, partially offset by payments
related to improvements to our terrestrial repeater network.
•2013 vs. 2012: For the years ended December 31, 2013 and 2012, free cash flow was
$927,496 and $709,446, respectively, an increase of $218,050. The increase was primarily
driven by higher net cash provided by operating activities from improved operating
performance, lower interest payments, and higher collections from subscribers and
distributors, partially offset by payments related to the launch of our FM-6 satellite and the
purchase of certain long-lead parts for a future satellite.
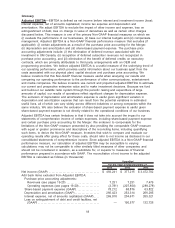
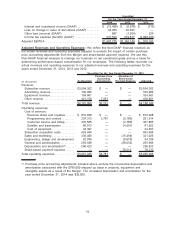
Adjusted EBITDA. EBITDA is defined as net income before interest and investment income
(loss); interest expense, net of amounts capitalized; income tax (expense) benefit and depreciation
and amortization. Adjusted EBITDA excludes the impact of other income and expense, losses on
extinguishment of debt, loss on change in value of derivatives as well as certain other non-cash
charges, such as certain purchase price accounting adjustments and share-based payment
expense. (For a reconciliation to GAAP see the accompanying glossary on pages 18 through 22 for
more details.)
•2014 vs. 2013: For the years ended December 31, 2014 and 2013, adjusted EBITDA was
$1,467,775 and $1,166,140, respectively, an increase of 26%, or $301,635. The increase was
due to growth in adjusted revenues primarily as a result of the increase in our subscriber
base and certain of our subscription rates, improved revenue share and OEM subsidy rates
per vehicle, and the renewal of certain programming agreements at more cost effective
terms; partially offset by higher legal expenses and costs associated with the growth in our
revenues and subscriber base.
•2013 vs. 2012: For the years ended December 31, 2013 and 2012, adjusted EBITDA was
$1,166,140 and $920,343, respectively, an increase of 27%, or $245,797. The increase was
primarily due to increases in adjusted revenues, partially offset by increases in expenses
included in adjusted EBITDA. The increase in adjusted revenues was primarily due to the
increase in our subscriber base and certain of our subscription rates. The increase in
expenses was primarily driven by higher revenue share and royalties expenses associated
with growth in revenues, sales and marketing costs related to subscriber communications and
retention marketing, customer service and billing costs related to increased agent training and
staffing as well as subscriber volume and subscriber acquisition costs.
Liquidity and Capital Resources
Cash Flows for the year ended December 31, 2014 compared with the year ended December 31,
2013 and the year ended December 31, 2013 compared with the year ended December 31, 2012.
13