XM Radio 2014 Annual Report Download - page 144
Download and view the complete annual report
Please find page 144 of the 2014 XM Radio annual report below. You can navigate through the pages in the report by either clicking on the pages listed below, or by using the keyword search tool below to find specific information within the annual report.-
 1
1 -
2
-
3
-
4
-
5
-
6
-
7
-
8
-
9
-
10
-
11
-
12
-
13
-
14
-
15
-
16
-
17
-
18
-
19
-
20
-
21
-
22
-
23
-
24
-
25
-
26
-
27
-
28
-
29
-
30
-
31
-
32
-
33
-
34
-
35
-
36
-
37
-
38
-
39
-
40
-
41
-
42
-
43
-
44
-
45
-
46
-
47
-
48
-
49
-
50
-
51
-
52
-
53
-
54
-
55
-
56
-
57
-
58
-
59
-
60
-
61
-
62
-
63
-
64
-
65
-
66
-
67
-
68
-
69
-
70
-
71
-
72
-
73
-
74
-
75
-
76
-
77
-
78
-
79
-
80
-
81
-
82
-
83
-
84
-
85
-
86
-
87
-
88
-
89
-
90
-
91
-
92
-
93
-
94
-
95
-
96
-
97
-
98
-
99
-
100
-
101
-
102
-
103
-
104
-
105
-
106
-
107
-
108
-
109
-
110
-
111
-
112
-
113
-
114
-
115
-
116
-
117
-
118
-
119
-
120
-
121
-
122
-
123
-
124
-
125
-
126
-
127
-
128
-
129
-
130
-
131
-
132
-
133
-
 134
134 -
 135
135 -
 136
136 -
 137
137 -
 138
138 -
 139
139 -
 140
140 -
 141
141 -
 142
142 -
 143
143 -
 144
144 -
 145
145 -
 146
146 -
 147
147 -
 148
148 -
 149
149
 |
 |

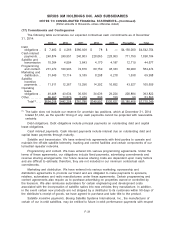
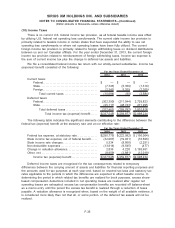
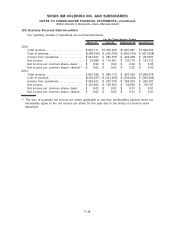
(20) Quarterly Financial Data–Unaudited
Our quarterly results of operations are summarized below:
March 31 June 30 September 30 December 31
For the Three Months Ended
2014
Total revenue . . . . . . . . . . . . . . . . . . . . . . . . . . . $ 997,711 $1,035,345 $1,057,087 $1,090,952
Cost of services. . . . . . . . . . . . . . . . . . . . . . . . . $(390,534) $ (393,185) $ (403,519) $ (421,098)
Income from operations. . . . . . . . . . . . . . . . . . $ 247,407 $ 284,578 $ 294,028 $ 293,657
Net income . . . . . . . . . . . . . . . . . . . . . . . . . . . . . $ 93,988 $ 119,961 $ 136,170 $ 143,122
Net income per common share—basic . . . $ 0.02 $ 0.02 $ 0.02 $ 0.03
Net income per common share—diluted(1) $ 0.02 $ 0.02 $ 0.02 $ 0.03
2013
Total revenue . . . . . . . . . . . . . . . . . . . . . . . . . . . $ 897,398 $ 940,110 $ 961,509 $1,000,078
Cost of services. . . . . . . . . . . . . . . . . . . . . . . . . $(330,257) $ (331,465) $ (336,464) $ (396,304)
Income from operations. . . . . . . . . . . . . . . . . . $ 246,931 $ 267,736 $ 284,529 $ 245,357
Net income . . . . . . . . . . . . . . . . . . . . . . . . . . . . . $ 123,602 $ 125,522 $ 62,894 $ 65,197
Net income per common share—basic . . . $ 0.02 $ 0.02 $ 0.01 $ 0.01
Net income per common share—diluted . . $ 0.02 $ 0.02 $ 0.01 $ 0.01
(1) The sum of quarterly net income per share applicable to common stockholders (diluted) does not
necessarily agree to the net income per share for the year due to the timing of common stock
issuances.
F-38
SIRIUS XM HOLDINGS INC. AND SUBSIDIARIES
NOTES TO CONSOLIDATED FINANCIAL STATEMENTS—(Continued)
(Dollar amounts in thousands, unless otherwise stated)