XM Radio 2014 Annual Report Download - page 109
Download and view the complete annual report
Please find page 109 of the 2014 XM Radio annual report below. You can navigate through the pages in the report by either clicking on the pages listed below, or by using the keyword search tool below to find specific information within the annual report.-
 1
1 -
2
-
3
-
4
-
5
-
6
-
7
-
8
-
9
-
10
-
11
-
12
-
13
-
14
-
15
-
16
-
17
-
18
-
19
-
20
-
21
-
22
-
23
-
24
-
25
-
26
-
27
-
28
-
29
-
30
-
31
-
32
-
33
-
34
-
35
-
36
-
37
-
38
-
39
-
40
-
41
-
42
-
43
-
44
-
45
-
46
-
47
-
48
-
49
-
50
-
51
-
52
-
53
-
54
-
55
-
56
-
57
-
58
-
59
-
60
-
61
-
62
-
63
-
64
-
65
-
66
-
67
-
68
-
69
-
70
-
71
-
72
-
73
-
74
-
75
-
76
-
77
-
78
-
79
-
80
-
81
-
82
-
83
-
84
-
85
-
86
-
87
-
88
-
89
-
90
-
91
-
92
-
93
-
94
-
95
-
96
-
97
-
98
-
 99
99 -
 100
100 -
 101
101 -
 102
102 -
 103
103 -
 104
104 -
 105
105 -
 106
106 -
 107
107 -
 108
108 -
 109
109 -
 110
110 -
 111
111 -
 112
112 -
 113
113 -
 114
114 -
 115
115 -
 116
116 -
 117
117 -
 118
118 -
 119
119 -
120
-
121
-
122
-
123
-
124
-
125
-
126
-
127
-
128
-
129
-
130
-
131
-
132
-
133
-
134
-
135
-
136
-
137
-
138
-
139
-
140
-
141
-
142
-
143
-
144
-
145
-
146
-
147
-
148
-
149
 |
 |

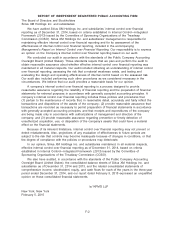
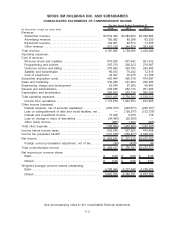
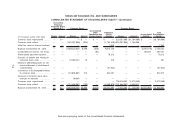
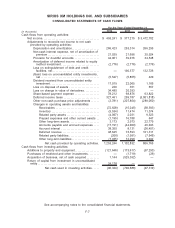
SIRIUS XM HOLDINGS INC. AND SUBSIDIARIES
CONSOLIDATED STATEMENTS OF COMPREHENSIVE INCOME
(in thousands, except per share data) 2014 2013 2012
For the Years Ended December 31,
Revenue:
Subscriber revenue. . . . . . . . . . . . . . . . . . . . . . . . . . . . . . . . . . . . . $3,554,302 $3,284,660 $2,962,665
Advertising revenue . . . . . . . . . . . . . . . . . . . . . . . . . . . . . . . . . . . . 100,982 89,288 82,320
Equipment revenue. . . . . . . . . . . . . . . . . . . . . . . . . . . . . . . . . . . . . 104,661 80,573 73,456
Other revenue. . . . . . . . . . . . . . . . . . . . . . . . . . . . . . . . . . . . . . . . . . 421,150 344,574 283,599
Total revenue . . . . . . . . . . . . . . . . . . . . . . . . . . . . . . . . . . . . . . . . . . . . 4,181,095 3,799,095 3,402,040
Operating expenses:
Cost of services:
Revenue share and royalties. . . . . . . . . . . . . . . . . . . . . . . . . . . . 810,028 677,642 551,012
Programming and content . . . . . . . . . . . . . . . . . . . . . . . . . . . . . . 297,313 290,323 278,997
Customer service and billing . . . . . . . . . . . . . . . . . . . . . . . . . . . . 370,585 320,755 294,980
Satellite and transmission. . . . . . . . . . . . . . . . . . . . . . . . . . . . . . . 86,013 79,292 72,615
Cost of equipment. . . . . . . . . . . . . . . . . . . . . . . . . . . . . . . . . . . . . . 44,397 26,478 31,766
Subscriber acquisition costs. . . . . . . . . . . . . . . . . . . . . . . . . . . . . . . 493,464 495,610 474,697
Sales and marketing. . . . . . . . . . . . . . . . . . . . . . . . . . . . . . . . . . . . . . 336,480 291,024 248,905
Engineering, design and development . . . . . . . . . . . . . . . . . . . . . 62,784 57,969 48,843
General and administrative. . . . . . . . . . . . . . . . . . . . . . . . . . . . . . . . 293,938 262,135 261,905
Depreciation and amortization . . . . . . . . . . . . . . . . . . . . . . . . . . . . . 266,423 253,314 266,295
Total operating expenses . . . . . . . . . . . . . . . . . . . . . . . . . . . . . . . . . 3,061,425 2,754,542 2,530,015
Income from operations. . . . . . . . . . . . . . . . . . . . . . . . . . . . . . . . . 1,119,670 1,044,553 872,025
Other income (expense):
Interest expense, net of amounts capitalized. . . . . . . . . . . . . (269,010) (204,671) (265,321)
Loss on extinguishment of debt and credit facilities, net . . — (190,577) (132,726)
Interest and investment income . . . . . . . . . . . . . . . . . . . . . . . . . 15,498 6,976 716
Loss on change in value of derivatives . . . . . . . . . . . . . . . . . . (34,485) (20,393) —
Other (loss) income . . . . . . . . . . . . . . . . . . . . . . . . . . . . . . . . . . . . (887) 1,204 (226)
Total other expense . . . . . . . . . . . . . . . . . . . . . . . . . . . . . . . . . . . . . . (288,884) (407,461) (397,557)
Income before income taxes . . . . . . . . . . . . . . . . . . . . . . . . . . . . . . 830,786 637,092 474,468
Income tax (expense) benefit . . . . . . . . . . . . . . . . . . . . . . . . . . . . . (337,545) (259,877) 2,998,234
Net income. . . . . . . . . . . . . . . . . . . . . . . . . . . . . . . . . . . . . . . . . . . . . . . $ 493,241 $ 377,215 $3,472,702
Foreign currency translation adjustment, net of tax . . . . . . . (94) (428) 49
Total comprehensive income . . . . . . . . . . . . . . . . . . . . . . . . . . . . . . $ 493,147 $ 376,787 $3,472,751
Net income per common share:
Basic . . . . . . . . . . . . . . . . . . . . . . . . . . . . . . . . . . . . . . . . . . . . . . . . . . $ 0.09 $ 0.06 $ 0.55
Diluted . . . . . . . . . . . . . . . . . . . . . . . . . . . . . . . . . . . . . . . . . . . . . . . . . $ 0.08 $ 0.06 $ 0.51
Weighted average common shares outstanding:
Basic . . . . . . . . . . . . . . . . . . . . . . . . . . . . . . . . . . . . . . . . . . . . . . . . . . 5,788,944 6,227,646 4,209,073
Diluted . . . . . . . . . . . . . . . . . . . . . . . . . . . . . . . . . . . . . . . . . . . . . . . . . 5,862,020 6,384,791 6,873,786
See accompanying notes to the consolidated financial statements.
F-3