XM Radio 2014 Annual Report Download - page 92
Download and view the complete annual report
Please find page 92 of the 2014 XM Radio annual report below. You can navigate through the pages in the report by either clicking on the pages listed below, or by using the keyword search tool below to find specific information within the annual report.-
 1
1 -
2
-
3
-
4
-
5
-
6
-
7
-
8
-
9
-
10
-
11
-
12
-
13
-
14
-
15
-
16
-
17
-
18
-
19
-
20
-
21
-
22
-
23
-
24
-
25
-
26
-
27
-
28
-
29
-
30
-
31
-
32
-
33
-
34
-
35
-
36
-
37
-
38
-
39
-
40
-
41
-
42
-
43
-
44
-
45
-
46
-
47
-
48
-
49
-
50
-
51
-
52
-
53
-
54
-
55
-
56
-
57
-
58
-
59
-
60
-
61
-
62
-
63
-
64
-
65
-
66
-
67
-
68
-
69
-
70
-
71
-
72
-
73
-
74
-
75
-
76
-
77
-
78
-
79
-
80
-
81
-
 82
82 -
 83
83 -
 84
84 -
 85
85 -
 86
86 -
 87
87 -
 88
88 -
 89
89 -
 90
90 -
 91
91 -
 92
92 -
 93
93 -
 94
94 -
 95
95 -
 96
96 -
 97
97 -
 98
98 -
 99
99 -
 100
100 -
 101
101 -
 102
102 -
103
-
104
-
105
-
106
-
107
-
108
-
109
-
110
-
111
-
112
-
113
-
114
-
115
-
116
-
117
-
118
-
119
-
120
-
121
-
122
-
123
-
124
-
125
-
126
-
127
-
128
-
129
-
130
-
131
-
132
-
133
-
134
-
135
-
136
-
137
-
138
-
139
-
140
-
141
-
142
-
143
-
144
-
145
-
146
-
147
-
148
-
149
 |
 |

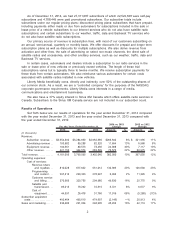
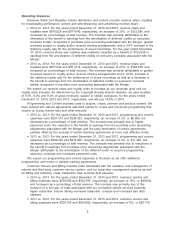
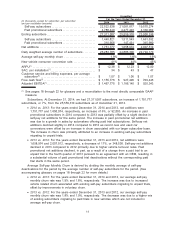
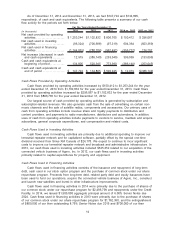
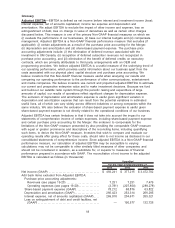
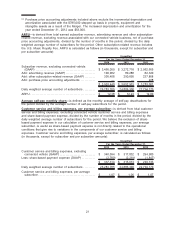
(in thousands, except for subscriber, per subscriber
and per installation amounts) 2014 2013 2012
For the Years Ended December 31,
Unaudited
Self-pay subscribers . . . . . . . . . . . . . . . . . . . . . . . . . . . . . . . . 22,522,638 21,081,817 19,570,274
Paid promotional subscribers . . . . . . . . . . . . . . . . . . . . . . . . 4,788,449 4,477,493 4,330,062
Ending subscribers . . . . . . . . . . . . . . . . . . . . . . . . . . . . . . . . . . . . 27,311,087 25,559,310 23,900,336
Self-pay subscribers . . . . . . . . . . . . . . . . . . . . . . . . . . . . . . . . 1,440,821 1,511,543 1,661,532
Paid promotional subscribers . . . . . . . . . . . . . . . . . . . . . . . . 310,956 147,431 345,980
Net additions . . . . . . . . . . . . . . . . . . . . . . . . . . . . . . . . . . . . . . . . . 1,751,777 1,658,974 2,007,512
Daily weighted average number of subscribers . . . . . . . . . 26,283,785 24,886,300 22,794,170
Average self-pay monthly churn . . . . . . . . . . . . . . . . . . . . . . . 1.9% 1.8% 1.9%
New vehicle consumer conversion rate. . . . . . . . . . . . . . . . . 41% 44% 45%
ARPU(1) . . . . . . . . . . . . . . . . . . . . . . . . . . . . . . . . . . . . . . . . . . . . . . $ 12.38 $ 12.23 $ 12.00
SAC, per installation(1)................................. $ 34 $ 43 $ 47
Customer service and billing expenses, per average
subscriber(1) . . . . . . . . . . . . . . . . . . . . . . . . . . . . . . . . . . . . . . . . $ 1.07 $ 1.06 $ 1.07
Free cash flow(1) . . . . . . . . . . . . . . . . . . . . . . . . . . . . . . . . . . . . . . $ 1,155,776 $ 927,496 $ 709,446
Adjusted EBITDA(1). . . . . . . . . . . . . . . . . . . . . . . . . . . . . . . . . . . . $ 1,467,775 $ 1,166,140 $ 920,343
(1) See pages 18 through 22 for glossary and a reconciliation to the most directly comparable GAAP
measure.
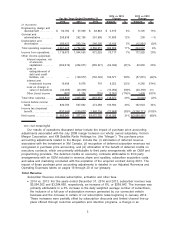
Subscribers. At December 31, 2014, we had 27,311,087 subscribers, an increase of 1,751,777
subscribers, or 7%, from the 25,559,310 subscribers as of December 31, 2013.
•2014 vs. 2013: For the years ended December 31, 2014 and 2013, net additions were
1,751,777 and 1,658,974, respectively, an increase of 6%, or 92,803. An increase in paid
promotional subscribers in 2014 compared to 2013 was partially offset by a slight decline in
self-pay net additions for the same period. The increase in paid promotional net additions
was due to a growth in sales by automakers offering paid trial subscriptions. Self-pay net
additions declined slightly in 2014 compared to 2013 as record new and used car
conversions were offset by an increase in churn associated with our larger subscriber base.
The increase in churn was primarily attributed to an increase in existing self-pay subscribers
migrating to unpaid trials.
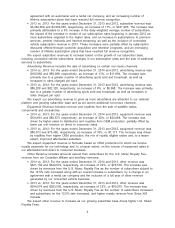
•2013 vs. 2012: For the years ended December 31, 2013 and 2012, net additions were
1,658,974 and 2,007,512, respectively, a decrease of 17%, or 348,538. Self-pay net additions
declined in 2013 compared to 2012 primarily due to higher vehicle turnover rates. Paid
promotional net additions declined, in part, as a result of a change from a paid trial to an
unpaid trial in the fourth quarter of 2013 pursuant to an agreement with an OEM, resulting in
a substantial volume of paid promotional trial deactivations without the corresponding paid
trial starts in the same period.
Average Self-pay Monthly Churn is derived by dividing the monthly average of self-pay
deactivations for the period by the average number of self-pay subscribers for the period. (See
accompanying glossary on pages 18 through 22 for more details.)
•2014 vs. 2013: For the years ended December 31, 2014 and 2013, our average self-pay
monthly churn rate was 1.9% and 1.8%, respectively. The increase was due to increased
vehicle related churn associated with existing self-pay subscribers migrating to unpaid trials,
offset by improvements in voluntary churn.
•2013 vs. 2012: For the years ended December 31, 2013 and 2012, our average self-pay
monthly churn rate was 1.8% and 1.9%, respectively. The decrease was due to a higher mix
of existing subscribers migrating to paid trials in new vehicles which are not included in
average self-pay churn.
11