XM Radio 2014 Annual Report Download - page 113
Download and view the complete annual report
Please find page 113 of the 2014 XM Radio annual report below. You can navigate through the pages in the report by either clicking on the pages listed below, or by using the keyword search tool below to find specific information within the annual report.-
 1
1 -
2
-
3
-
4
-
5
-
6
-
7
-
8
-
9
-
10
-
11
-
12
-
13
-
14
-
15
-
16
-
17
-
18
-
19
-
20
-
21
-
22
-
23
-
24
-
25
-
26
-
27
-
28
-
29
-
30
-
31
-
32
-
33
-
34
-
35
-
36
-
37
-
38
-
39
-
40
-
41
-
42
-
43
-
44
-
45
-
46
-
47
-
48
-
49
-
50
-
51
-
52
-
53
-
54
-
55
-
56
-
57
-
58
-
59
-
60
-
61
-
62
-
63
-
64
-
65
-
66
-
67
-
68
-
69
-
70
-
71
-
72
-
73
-
74
-
75
-
76
-
77
-
78
-
79
-
80
-
81
-
82
-
83
-
84
-
85
-
86
-
87
-
88
-
89
-
90
-
91
-
92
-
93
-
94
-
95
-
96
-
97
-
98
-
99
-
100
-
101
-
102
-
 103
103 -
 104
104 -
 105
105 -
 106
106 -
 107
107 -
 108
108 -
 109
109 -
 110
110 -
 111
111 -
 112
112 -
 113
113 -
 114
114 -
 115
115 -
 116
116 -
 117
117 -
 118
118 -
 119
119 -
 120
120 -
 121
121 -
 122
122 -
 123
123 -
124
-
125
-
126
-
127
-
128
-
129
-
130
-
131
-
132
-
133
-
134
-
135
-
136
-
137
-
138
-
139
-
140
-
141
-
142
-
143
-
144
-
145
-
146
-
147
-
148
-
149
 |
 |

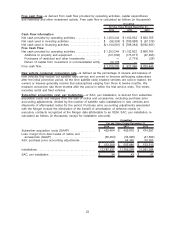
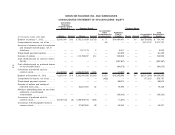
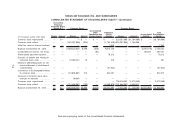
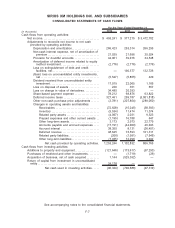
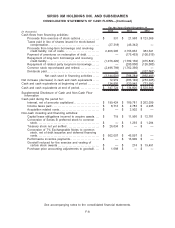
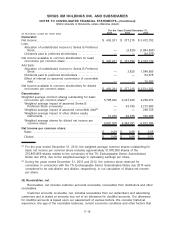
(in thousands) 2014 2013 2012
For the Years Ended December 31,
Cash flows from operating activities:
Net income. . . . . . . . . . . . . . . . . . . . . . . . . . . . . . . . . . . . . . . . . . $ 493,241 $ 377,215 $ 3,472,702
Adjustments to reconcile net income to net cash
provided by operating activities:
Depreciation and amortization. . . . . . . . . . . . . . . . . . . . 266,423 253,314 266,295
Non-cash interest expense, net of amortization of
premium . . . . . . . . . . . . . . . . . . . . . . . . . . . . . . . . . . . . . . 21,039 21,698 35,924
Provision for doubtful accounts. . . . . . . . . . . . . . . . . . . 44,961 39,016 34,548
Amortization of deferred income related to equity
method investment . . . . . . . . . . . . . . . . . . . . . . . . . . . . (2,776) (2,776) (2,776)
Loss on extinguishment of debt and credit
facilities, net . . . . . . . . . . . . . . . . . . . . . . . . . . . . . . . . . . — 190,577 132,726
(Gain) loss on unconsolidated entity investments,
net . . . . . . . . . . . . . . . . . . . . . . . . . . . . . . . . . . . . . . . . . . . (5,547) (5,865) 420
Dividend received from unconsolidated entity
investment . . . . . . . . . . . . . . . . . . . . . . . . . . . . . . . . . . . . 17,019 22,065 1,185
Loss on disposal of assets . . . . . . . . . . . . . . . . . . . . . . 220 351 657
Loss on change in value of derivatives . . . . . . . . . . . 34,485 20,393 —
Share-based payment expense . . . . . . . . . . . . . . . . . . 78,212 68,876 63,822
Deferred income taxes . . . . . . . . . . . . . . . . . . . . . . . . . . 327,461 259,787 (3,001,818)
Other non-cash purchase price adjustments . . . . . . (3,781) (207,854) (289,050)
Changes in operating assets and liabilities:
Receivables . . . . . . . . . . . . . . . . . . . . . . . . . . . . . . . . (72,628) (15,245) (58,593)
Inventory . . . . . . . . . . . . . . . . . . . . . . . . . . . . . . . . . . . (5,534) 11,474 11,374
Related party assets . . . . . . . . . . . . . . . . . . . . . . . . (4,097) 2,031 9,523
Prepaid expenses and other current assets . . (1,195) 16,788 647
Other long-term assets . . . . . . . . . . . . . . . . . . . . . . 3,173 2,973 22,779
Accounts payable and accrued expenses . . . . (17,191) (44,009) 46,043
Accrued interest . . . . . . . . . . . . . . . . . . . . . . . . . . . . 38,355 8,131 (36,451)
Deferred revenue . . . . . . . . . . . . . . . . . . . . . . . . . . . 48,645 73,593 101,311
Related party liabilities . . . . . . . . . . . . . . . . . . . . . . (206) (1,991) (7,545)
Other long-term liabilities . . . . . . . . . . . . . . . . . . . . (7,035) 12,290 3,042
Net cash provided by operating activities. 1,253,244 1,102,832 806,765
Cash flows from investing activities:
Additions to property and equipment. . . . . . . . . . . . . . . . . . (121,646) (173,617) (97,293)
Purchases of restricted and other investments . . . . . . . . — (1,719) (26)
Acquisition of business, net of cash acquired . . . . . . . . . 1,144 (525,352) —
Return of capital from investment in unconsolidated
entity . . . . . . . . . . . . . . . . . . . . . . . . . . . . . . . . . . . . . . . . . . . . . 24,178 — —
Net cash used in investing activities . . . . . (96,324) (700,688) (97,319)
See accompanying notes to the consolidated financial statements.
F-7
SIRIUS XM HOLDINGS INC. AND SUBSIDIARIES
CONSOLIDATED STATEMENTS OF CASH FLOWS