XM Radio 2014 Annual Report Download - page 106
Download and view the complete annual report
Please find page 106 of the 2014 XM Radio annual report below. You can navigate through the pages in the report by either clicking on the pages listed below, or by using the keyword search tool below to find specific information within the annual report.-
 1
1 -
2
-
3
-
4
-
5
-
6
-
7
-
8
-
9
-
10
-
11
-
12
-
13
-
14
-
15
-
16
-
17
-
18
-
19
-
20
-
21
-
22
-
23
-
24
-
25
-
26
-
27
-
28
-
29
-
30
-
31
-
32
-
33
-
34
-
35
-
36
-
37
-
38
-
39
-
40
-
41
-
42
-
43
-
44
-
45
-
46
-
47
-
48
-
49
-
50
-
51
-
52
-
53
-
54
-
55
-
56
-
57
-
58
-
59
-
60
-
61
-
62
-
63
-
64
-
65
-
66
-
67
-
68
-
69
-
70
-
71
-
72
-
73
-
74
-
75
-
76
-
77
-
78
-
79
-
80
-
81
-
82
-
83
-
84
-
85
-
86
-
87
-
88
-
89
-
90
-
91
-
92
-
93
-
94
-
95
-
 96
96 -
 97
97 -
 98
98 -
 99
99 -
 100
100 -
 101
101 -
 102
102 -
 103
103 -
 104
104 -
 105
105 -
 106
106 -
 107
107 -
 108
108 -
 109
109 -
 110
110 -
 111
111 -
 112
112 -
 113
113 -
 114
114 -
 115
115 -
 116
116 -
117
-
118
-
119
-
120
-
121
-
122
-
123
-
124
-
125
-
126
-
127
-
128
-
129
-
130
-
131
-
132
-
133
-
134
-
135
-
136
-
137
-
138
-
139
-
140
-
141
-
142
-
143
-
144
-
145
-
146
-
147
-
148
-
149
 |
 |

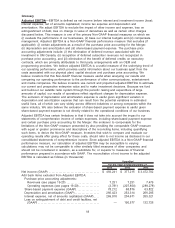
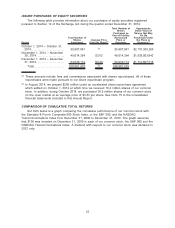
(in thousands, except per share data) 2014 2013(1) 2012(2) 2011 2010
As of and for the Years Ended December 31,
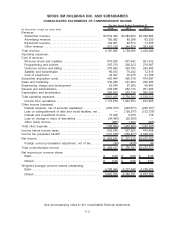
Statements of Comprehensive
Income Data:
Total revenue . . . . . . . . . . . . . . $4,181,095 $3,799,095 $3,402,040 $3,014,524 $2,816,992
Net income . . . . . . . . . . . . . . . . $ 493,241 $ 377,215 $3,472,702 $ 426,961 $ 43,055
Net income per share—
basic . . . . . . . . . . . . . . . . . . . . $ 0.09 $ 0.06 $ 0.55 $ 0.07 $ 0.01
Net income per share—
diluted. . . . . . . . . . . . . . . . . . . $ 0.08 $ 0.06 $ 0.51 $ 0.07 $ 0.01
Weighted average common
shares outstanding—
basic . . . . . . . . . . . . . . . . . . . . 5,788,944 6,227,646 4,209,073 3,744,606 3,693,259
Weighted average common
shares outstanding—
diluted. . . . . . . . . . . . . . . . . . . 5,862,020 6,384,791 6,873,786 6,500,822 6,391,071
Cash dividends per share . . $ — $ — $ 0.05 $ — $ —
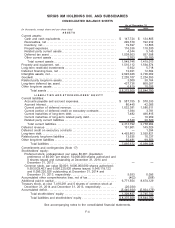
Balance Sheet Data:
Cash and cash equivalents . $ 147,724 $ 134,805 $ 520,945 $ 773,990 $ 586,691
Restricted investments . . . . . $ 5,922 $ 5,718 $ 3,999 $ 3,973 $ 3,396
Total assets . . . . . . . . . . . . . . . $8,375,509 $8,844,780 $9,054,843 $7,495,996 $7,383,086
Long-term debt, net of
current portion . . . . . . . . . . . $4,493,863 $3,093,821 $2,430,986 $3,012,351 $3,021,763
Stockholders’ equity. . . . . . . . $1,309,837 $2,745,742 $4,039,565 $ 704,145 $ 207,636
(1) The selected financial data for 2013 includes the balances and approximately two months of
activity related to the acquisition of the connected vehicle business of Agero, Inc. in November
2013.
(2) For the year ended December 31, 2012, we had an income tax benefit of $2,998,234 due to the
release of our valuation allowance. A special cash dividend was paid during 2012.
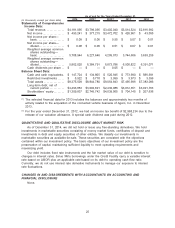
QUANTITATIVE AND QUALITATIVE DISCLOSURE ABOUT MARKET RISK
As of December 31, 2014, we did not hold or issue any free-standing derivatives. We hold
investments in marketable securities consisting of money market funds, certificates of deposit and
investments in debt and equity securities of other entities. We classify our investments in
marketable securities as available-for-sale. These securities are consistent with the objectives
contained within our investment policy. The basic objectives of our investment policy are the
preservation of capital, maintaining sufficient liquidity to meet operating requirements and
maximizing yield.
Our debt includes fixed rate instruments and the fair market value of our debt is sensitive to
changes in interest rates. Sirius XM’s borrowings under the Credit Facility carry a variable interest
rate based on LIBOR plus an applicable rate based on its debt to operating cash flow ratio.
Currently, we do not use interest rate derivative instruments to manage our exposure to interest
rate fluctuations.
CHANGES IN AND DISAGREEMENTS WITH ACCOUNTANTS ON ACCOUNTING AND
FINANCIAL DISCLOSURE
None.
25