XM Radio 2014 Annual Report Download - page 110
Download and view the complete annual report
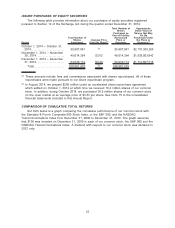
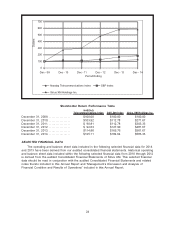
Please find page 110 of the 2014 XM Radio annual report below. You can navigate through the pages in the report by either clicking on the pages listed below, or by using the keyword search tool below to find specific information within the annual report.-
 1
1 -
2
-
3
-
4
-
5
-
6
-
7
-
8
-
9
-
10
-
11
-
12
-
13
-
14
-
15
-
16
-
17
-
18
-
19
-
20
-
21
-
22
-
23
-
24
-
25
-
26
-
27
-
28
-
29
-
30
-
31
-
32
-
33
-
34
-
35
-
36
-
37
-
38
-
39
-
40
-
41
-
42
-
43
-
44
-
45
-
46
-
47
-
48
-
49
-
50
-
51
-
52
-
53
-
54
-
55
-
56
-
57
-
58
-
59
-
60
-
61
-
62
-
63
-
64
-
65
-
66
-
67
-
68
-
69
-
70
-
71
-
72
-
73
-
74
-
75
-
76
-
77
-
78
-
79
-
80
-
81
-
82
-
83
-
84
-
85
-
86
-
87
-
88
-
89
-
90
-
91
-
92
-
93
-
94
-
95
-
96
-
97
-
98
-
99
-
 100
100 -
 101
101 -
 102
102 -
 103
103 -
 104
104 -
 105
105 -
 106
106 -
 107
107 -
 108
108 -
 109
109 -
 110
110 -
 111
111 -
 112
112 -
 113
113 -
 114
114 -
 115
115 -
 116
116 -
 117
117 -
 118
118 -
 119
119 -
 120
120 -
121
-
122
-
123
-
124
-
125
-
126
-
127
-
128
-
129
-
130
-
131
-
132
-
133
-
134
-
135
-
136
-
137
-
138
-
139
-
140
-
141
-
142
-
143
-
144
-
145
-
146
-
147
-
148
-
149
 |
 |

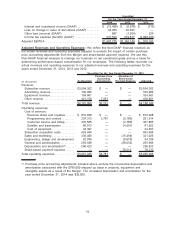
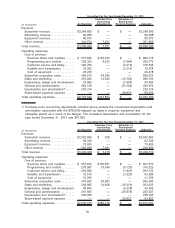
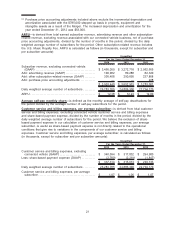
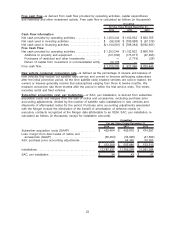
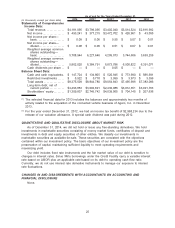
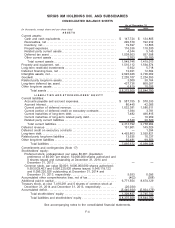
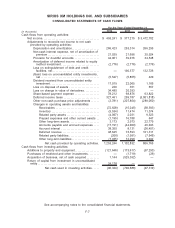
SIRIUS XM HOLDINGS INC. AND SUBSIDIARIES
CONSOLIDATED BALANCE SHEETS
(in thousands, except share and per share data) 2014 2013
As of December 31,
ASSETS
Current assets:
Cash and cash equivalents . . . . . . . . . . . . . . . . . . . . . . . . . . . . . . . . . . . . . . . . . $ 147,724 $ 134,805
Receivables, net . . . . . . . . . . . . . . . . . . . . . . . . . . . . . . . . . . . . . . . . . . . . . . . . . . . 220,579 192,912
Inventory, net . . . . . . . . . . . . . . . . . . . . . . . . . . . . . . . . . . . . . . . . . . . . . . . . . . . . . . 19,397 13,863
Prepaid expenses . . . . . . . . . . . . . . . . . . . . . . . . . . . . . . . . . . . . . . . . . . . . . . . . . . 116,336 110,530
Related party current assets . . . . . . . . . . . . . . . . . . . . . . . . . . . . . . . . . . . . . . . . 4,344 9,145
Deferred tax asset . . . . . . . . . . . . . . . . . . . . . . . . . . . . . . . . . . . . . . . . . . . . . . . . . 1,038,603 937,598
Other current assets . . . . . . . . . . . . . . . . . . . . . . . . . . . . . . . . . . . . . . . . . . . . . . . 2,763 20,160
Total current assets . . . . . . . . . . . . . . . . . . . . . . . . . . . . . . . . . . . . . . . . . . . . . . 1,549,746 1,419,013
Property and equipment, net. . . . . . . . . . . . . . . . . . . . . . . . . . . . . . . . . . . . . . . . . . 1,510,112 1,594,574
Long-term restricted investments . . . . . . . . . . . . . . . . . . . . . . . . . . . . . . . . . . . . . . 5,922 5,718
Deferred financing fees, net . . . . . . . . . . . . . . . . . . . . . . . . . . . . . . . . . . . . . . . . . . 12,021 12,604
Intangible assets, net. . . . . . . . . . . . . . . . . . . . . . . . . . . . . . . . . . . . . . . . . . . . . . . . . 2,645,046 2,700,062
Goodwill . . . . . . . . . . . . . . . . . . . . . . . . . . . . . . . . . . . . . . . . . . . . . . . . . . . . . . . . . . . . . 2,205,107 2,204,553
Related party long-term assets. . . . . . . . . . . . . . . . . . . . . . . . . . . . . . . . . . . . . . . . 3,000 30,164
Long-term deferred tax asset . . . . . . . . . . . . . . . . . . . . . . . . . . . . . . . . . . . . . . . . . 437,736 868,057
Other long-term assets . . . . . . . . . . . . . . . . . . . . . . . . . . . . . . . . . . . . . . . . . . . . . . . 6,819 10,035
Total assets . . . . . . . . . . . . . . . . . . . . . . . . . . . . . . . . . . . . . . . . . . . . . . . . . . . $ 8,375,509 $ 8,844,780
LIABILITIES AND STOCKHOLDERS’ EQUITY
Current liabilities:
Accounts payable and accrued expenses. . . . . . . . . . . . . . . . . . . . . . . . . . . . $ 587,755 $ 578,333
Accrued interest. . . . . . . . . . . . . . . . . . . . . . . . . . . . . . . . . . . . . . . . . . . . . . . . . . . . 80,440 42,085
Current portion of deferred revenue . . . . . . . . . . . . . . . . . . . . . . . . . . . . . . . . . 1,632,381 1,586,611
Current portion of deferred credit on executory contracts. . . . . . . . . . . . . 1,394 3,781
Current maturities of long-term debt. . . . . . . . . . . . . . . . . . . . . . . . . . . . . . . . . 7,482 496,815
Current maturities of long-term related party debt . . . . . . . . . . . . . . . . . . . . — 10,959
Related party current liabilities . . . . . . . . . . . . . . . . . . . . . . . . . . . . . . . . . . . . . . 4,340 20,320
Total current liabilities . . . . . . . . . . . . . . . . . . . . . . . . . . . . . . . . . . . . . . . . . . . . 2,313,792 2,738,904
Deferred revenue . . . . . . . . . . . . . . . . . . . . . . . . . . . . . . . . . . . . . . . . . . . . . . . . . . . . 151,901 149,026
Deferred credit on executory contracts . . . . . . . . . . . . . . . . . . . . . . . . . . . . . . . . — 1,394
Long-term debt. . . . . . . . . . . . . . . . . . . . . . . . . . . . . . . . . . . . . . . . . . . . . . . . . . . . . . . 4,493,863 3,093,821
Related party long-term liabilities. . . . . . . . . . . . . . . . . . . . . . . . . . . . . . . . . . . . . . 13,635 16,337
Other long-term liabilities . . . . . . . . . . . . . . . . . . . . . . . . . . . . . . . . . . . . . . . . . . . . . 92,481 99,556
Total liabilities . . . . . . . . . . . . . . . . . . . . . . . . . . . . . . . . . . . . . . . . . . . . . . . . . 7,065,672 6,099,038
Commitments and contingencies (Note 17)
Stockholders’ equity:
Preferred stock, undesignated, par value $0.001 (liquidation
preference of $0.001 per share); 50,000,000 shares authorized and
0 shares issued and outstanding at December 31, 2014 and
December 31, 2013 . . . . . . . . . . . . . . . . . . . . . . . . . . . . . . . . . . . . . . . . . . . . . . — —
Common stock, par value $0.001; 9,000,000,000 shares authorized;
5,653,529,403 and 6,096,220,526 shares issued; 5,646,119,122
and 6,096,220,526 outstanding at December 31, 2014 and
December 31, 2013, respectively . . . . . . . . . . . . . . . . . . . . . . . . . . . . . . . . . 5,653 6,096
Accumulated other comprehensive loss, net of tax . . . . . . . . . . . . . . . . . . . . . (402) (308)
Additional paid-in capital . . . . . . . . . . . . . . . . . . . . . . . . . . . . . . . . . . . . . . . . . . . . . . 6,771,554 8,674,129
Treasury stock, at cost; 7,410,281 and 0 shares of common stock at
December 31, 2014 and December 31, 2013, respectively . . . . . . . . . . . (26,034) —
Accumulated deficit. . . . . . . . . . . . . . . . . . . . . . . . . . . . . . . . . . . . . . . . . . . . . . . . . . . (5,440,934) (5,934,175)
Total stockholders’ equity . . . . . . . . . . . . . . . . . . . . . . . . . . . . . . . . . . . . . . 1,309,837 2,745,742
Total liabilities and stockholders’ equity . . . . . . . . . . . . . . . . . . . . . . . . . $ 8,375,509 $ 8,844,780
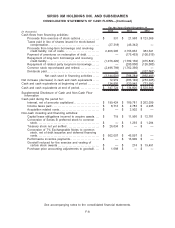
See accompanying notes to the consolidated financial statements.
F-4