XM Radio 2014 Annual Report Download - page 87
Download and view the complete annual report
Please find page 87 of the 2014 XM Radio annual report below. You can navigate through the pages in the report by either clicking on the pages listed below, or by using the keyword search tool below to find specific information within the annual report.-
 1
1 -
2
-
3
-
4
-
5
-
6
-
7
-
8
-
9
-
10
-
11
-
12
-
13
-
14
-
15
-
16
-
17
-
18
-
19
-
20
-
21
-
22
-
23
-
24
-
25
-
26
-
27
-
28
-
29
-
30
-
31
-
32
-
33
-
34
-
35
-
36
-
37
-
38
-
39
-
40
-
41
-
42
-
43
-
44
-
45
-
46
-
47
-
48
-
49
-
50
-
51
-
52
-
53
-
54
-
55
-
56
-
57
-
58
-
59
-
60
-
61
-
62
-
63
-
64
-
65
-
66
-
67
-
68
-
69
-
70
-
71
-
72
-
73
-
74
-
75
-
76
-
 77
77 -
 78
78 -
 79
79 -
 80
80 -
 81
81 -
 82
82 -
 83
83 -
 84
84 -
 85
85 -
 86
86 -
 87
87 -
 88
88 -
 89
89 -
 90
90 -
 91
91 -
 92
92 -
 93
93 -
 94
94 -
 95
95 -
 96
96 -
 97
97 -
98
-
99
-
100
-
101
-
102
-
103
-
104
-
105
-
106
-
107
-
108
-
109
-
110
-
111
-
112
-
113
-
114
-
115
-
116
-
117
-
118
-
119
-
120
-
121
-
122
-
123
-
124
-
125
-
126
-
127
-
128
-
129
-
130
-
131
-
132
-
133
-
134
-
135
-
136
-
137
-
138
-
139
-
140
-
141
-
142
-
143
-
144
-
145
-
146
-
147
-
148
-
149
 |
 |
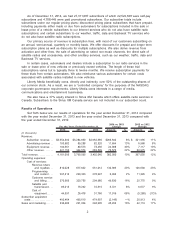
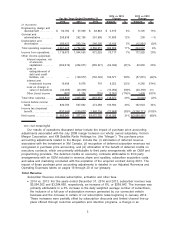
but remained flat as a percentage of total revenue. The increase was primarily due to efforts
to improve our customer service experience, resulting in higher spend on customer service
agents, staffing and training, higher subscriber volume driving increased subscriber contacts,
increased bad debt expense and higher technology costs.
We expect our customer service and billing expenses to increase as our subscriber base
grows.
Satellite and Transmission consists of costs associated with the operation and maintenance of
our terrestrial repeater networks; satellites; satellite telemetry, tracking and control systems; satellite
uplink facilities; broadcast studios; and delivery of our Internet streaming service.
•2014 vs. 2013: For the years ended December 31, 2014 and 2013, satellite and transmission
expenses were $86,013 and $79,292, respectively, an increase of 8%, or $6,721, but
remained flat as a percentage of total revenue. The increase was primarily due to increased
personnel costs, costs associated with our Internet streaming operations, satellite insurance
expense, and terrestrial repeater network costs.
•2013 vs. 2012: For the years ended December 31, 2013 and 2012, satellite and transmission
expenses were $79,292 and $72,615, respectively, an increase of 9%, or $6,677, but
remained flat as a percentage of total revenue. The increase was primarily due to increased
costs associated with our Internet streaming operations.
We expect satellite and transmission expenses to increase slightly as higher Internet streaming
and terrestrial repeater network costs are partially offset by decreases in satellite insurance costs.
Cost of Equipment includes costs from the sale of satellite radios, components and accessories
and provisions for inventory allowance attributable to products purchased for resale in our direct to
consumer distribution channels.
•2014 vs. 2013: For the years ended December 31, 2014 and 2013, cost of equipment was
$44,397 and $26,478, respectively, an increase of 68%, or $17,919, and increased as a
percentage of equipment revenue. The increase was primarily due to higher sales to
distributors, partially offset by lower costs per unit on direct to consumer sales.
•2013 vs. 2012: For the years ended December 31, 2013 and 2012, cost of equipment was
$26,478 and $31,766, respectively, a decrease of 17%, or $5,288, and decreased as a
percentage of equipment revenue. The decrease was primarily due to lower average cost per
product sold and lower inventory reserves, partially offset by higher direct to consumer
volume compared to prior year periods.
We expect cost of equipment to fluctuate with changes in sales and inventory valuations.
Subscriber Acquisition Costs include hardware subsidies paid to radio manufacturers,
distributors and automakers; subsidies paid for chipsets and certain other components used in
manufacturing radios; device royalties for certain radios and chipsets; commissions paid to
automakers and retailers; product warranty obligations; freight; and provisions for inventory
allowances attributable to inventory consumed in our OEM and retail distribution channels. The
majority of subscriber acquisition costs are incurred and expensed in advance of, or concurrent
with, acquiring a subscriber. Subscriber acquisition costs do not include advertising costs,
marketing, loyalty payments to distributors and dealers of satellite radios or revenue share
payments to automakers and retailers of satellite radios.
•2014 vs. 2013: For the years ended December 31, 2014 and 2013, subscriber acquisition
costs were $493,464 and $495,610, respectively, a decrease of $2,146, and decreased as a
percentage of total revenue. Improved OEM subsidy rates per vehicle and a change in a
contract with an automaker decreased subscriber acquisition costs. The decrease was
partially offset by the elimination of the benefit to earnings in 2014 from the amortization of
deferred credits on executory contracts initially recognized in purchase price accounting
associated with the Merger and increased subsidy costs related to a larger number of
satellite radio installations in new vehicles. For the year ended December 31, 2013, the
benefit to earnings from amortization of deferred credits was $64,365.
6