XM Radio 2014 Annual Report Download - page 142
Download and view the complete annual report
Please find page 142 of the 2014 XM Radio annual report below. You can navigate through the pages in the report by either clicking on the pages listed below, or by using the keyword search tool below to find specific information within the annual report.-
 1
1 -
2
-
3
-
4
-
5
-
6
-
7
-
8
-
9
-
10
-
11
-
12
-
13
-
14
-
15
-
16
-
17
-
18
-
19
-
20
-
21
-
22
-
23
-
24
-
25
-
26
-
27
-
28
-
29
-
30
-
31
-
32
-
33
-
34
-
35
-
36
-
37
-
38
-
39
-
40
-
41
-
42
-
43
-
44
-
45
-
46
-
47
-
48
-
49
-
50
-
51
-
52
-
53
-
54
-
55
-
56
-
57
-
58
-
59
-
60
-
61
-
62
-
63
-
64
-
65
-
66
-
67
-
68
-
69
-
70
-
71
-
72
-
73
-
74
-
75
-
76
-
77
-
78
-
79
-
80
-
81
-
82
-
83
-
84
-
85
-
86
-
87
-
88
-
89
-
90
-
91
-
92
-
93
-
94
-
95
-
96
-
97
-
98
-
99
-
100
-
101
-
102
-
103
-
104
-
105
-
106
-
107
-
108
-
109
-
110
-
111
-
112
-
113
-
114
-
115
-
116
-
117
-
118
-
119
-
120
-
121
-
122
-
123
-
124
-
125
-
126
-
127
-
128
-
129
-
130
-
131
-
 132
132 -
 133
133 -
 134
134 -
 135
135 -
 136
136 -
 137
137 -
 138
138 -
 139
139 -
 140
140 -
 141
141 -
 142
142 -
 143
143 -
 144
144 -
 145
145 -
 146
146 -
 147
147 -
 148
148 -
 149
149
 |
 |

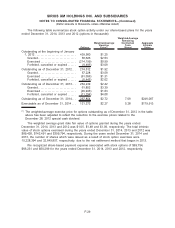
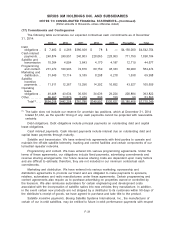
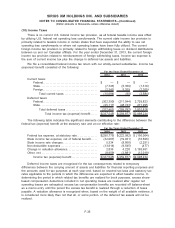
The tax effects of temporary differences that give rise to significant portions of the deferred tax
assets and deferred tax liabilities are presented below:
2014 2013
For the Years Ended
December 31,
Deferred tax assets:
Net operating loss carryforwards . . . . . . . . . . . . . . . . . . . . . . . . . $ 1,818,719 $ 2,207,583
GM payments and liabilities . . . . . . . . . . . . . . . . . . . . . . . . . . . . . . 539 1,984
Deferred revenue. . . . . . . . . . . . . . . . . . . . . . . . . . . . . . . . . . . . . . . . 691,323 606,430
Severance accrual. . . . . . . . . . . . . . . . . . . . . . . . . . . . . . . . . . . . . . . 271 388
Accrued bonus . . . . . . . . . . . . . . . . . . . . . . . . . . . . . . . . . . . . . . . . . . 28,170 25,830
Expensed costs capitalized for tax . . . . . . . . . . . . . . . . . . . . . . . 19,624 22,679
Deferred financing costs . . . . . . . . . . . . . . . . . . . . . . . . . . . . . . . . . 958 664
Investments . . . . . . . . . . . . . . . . . . . . . . . . . . . . . . . . . . . . . . . . . . . . . 46,751 45,078
Stock based compensation. . . . . . . . . . . . . . . . . . . . . . . . . . . . . . . 79,296 71,794
Other . . . . . . . . . . . . . . . . . . . . . . . . . . . . . . . . . . . . . . . . . . . . . . . . . . . 36,597 31,735
Total deferred tax assets . . . . . . . . . . . . . . . . . . . . . . . . . . . . 2,722,248 3,014,165
Deferred tax liabilities:
Depreciation of property and equipment . . . . . . . . . . . . . . . . . . (237,971) (188,675)
FCC license. . . . . . . . . . . . . . . . . . . . . . . . . . . . . . . . . . . . . . . . . . . . . (789,857) (778,152)
Other intangible assets . . . . . . . . . . . . . . . . . . . . . . . . . . . . . . . . . . (213,086) (233,983)
Total deferred tax liabilities . . . . . . . . . . . . . . . . . . . . . . . . . . (1,240,914) (1,200,810)
Net deferred tax assets before valuation allowance. . . . . . . . . . . . 1,481,334 1,813,355
Valuation allowance. . . . . . . . . . . . . . . . . . . . . . . . . . . . . . . . . . . . . . . . . . (4,995) (7,831)
Total net deferred tax asset . . . . . . . . . . . . . . . . . . . . . . . . . $ 1,476,339 $ 1,805,524
The ultimate realization of deferred tax assets is dependent upon the generation of future
taxable income during the periods in which those temporary differences can be carried forward
under tax law. Management’s evaluation of the realizability of deferred tax assets considers both
positive and negative evidence, including historical financial performance, scheduled reversal of
deferred tax assets and liabilities, projected taxable income and tax planning strategies in making
this assessment. The weight given to the potential effects of positive and negative evidence is
based on the extent to which it can be objectively verified. The net deferred tax assets are primarily
related to gross net operating loss carryforwards of approximately $4,794,924. In addition to the
gross book net operating loss carryforwards, we have $753,218 of excess share-based
compensation deductions that will not be realized until we utilize the $4,794,924 of net operating
losses, resulting in an approximate gross operating loss carryforward on our tax return of
$5,548,142.
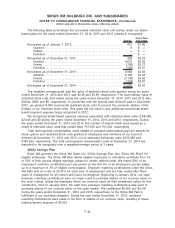
For the year ended December 31, 2012, our deferred tax asset valuation allowance decreased
by $3,350,905 in response to cumulative positive evidence in 2012 which outweighed the historical
negative evidence from our emergence from cumulative losses in recent years and updated
assessments regarding that it was more likely than not that our deferred tax assets will be realized.
As of December 31, 2014 and 2013, the deferred tax asset valuation allowance of $4,995 and
$7,831, respectively, related to deferred tax assets that are not likely to be realized due to certain
state net operating loss limitations we are not more likely than not going to utilize. These net
operating loss carryforwards expire on various dates beginning in 2017 and ending in 2028.
ASC 740 requires a company to first determine whether it is more likely than not that a tax
position will be sustained based on its technical merits as of the reporting date, assuming that
taxing authorities will examine the position and have full knowledge of all relevant information. A tax
F-36
SIRIUS XM HOLDINGS INC. AND SUBSIDIARIES
NOTES TO CONSOLIDATED FINANCIAL STATEMENTS—(Continued)
(Dollar amounts in thousands, unless otherwise stated)