XM Radio 2014 Annual Report Download - page 103
Download and view the complete annual report
Please find page 103 of the 2014 XM Radio annual report below. You can navigate through the pages in the report by either clicking on the pages listed below, or by using the keyword search tool below to find specific information within the annual report.-
 1
1 -
2
-
3
-
4
-
5
-
6
-
7
-
8
-
9
-
10
-
11
-
12
-
13
-
14
-
15
-
16
-
17
-
18
-
19
-
20
-
21
-
22
-
23
-
24
-
25
-
26
-
27
-
28
-
29
-
30
-
31
-
32
-
33
-
34
-
35
-
36
-
37
-
38
-
39
-
40
-
41
-
42
-
43
-
44
-
45
-
46
-
47
-
48
-
49
-
50
-
51
-
52
-
53
-
54
-
55
-
56
-
57
-
58
-
59
-
60
-
61
-
62
-
63
-
64
-
65
-
66
-
67
-
68
-
69
-
70
-
71
-
72
-
73
-
74
-
75
-
76
-
77
-
78
-
79
-
80
-
81
-
82
-
83
-
84
-
85
-
86
-
87
-
88
-
89
-
90
-
91
-
92
-
 93
93 -
 94
94 -
 95
95 -
 96
96 -
 97
97 -
 98
98 -
 99
99 -
 100
100 -
 101
101 -
 102
102 -
 103
103 -
 104
104 -
 105
105 -
 106
106 -
 107
107 -
 108
108 -
 109
109 -
 110
110 -
 111
111 -
 112
112 -
 113
113 -
114
-
115
-
116
-
117
-
118
-
119
-
120
-
121
-
122
-
123
-
124
-
125
-
126
-
127
-
128
-
129
-
130
-
131
-
132
-
133
-
134
-
135
-
136
-
137
-
138
-
139
-
140
-
141
-
142
-
143
-
144
-
145
-
146
-
147
-
148
-
149
 |
 |

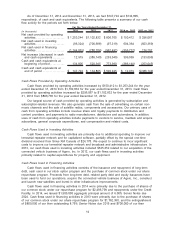
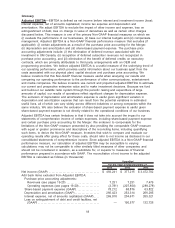
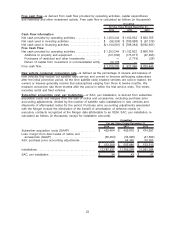
Free cash flow—is derived from cash flow provided by operating activities, capital expenditures
and restricted and other investment activity. Free cash flow is calculated as follows (in thousands):
2014 2013 2012
For the Years Ended December 31,
Unaudited
Cash Flow information
Net cash provided by operating activities. . . . . . . . . . . . . . . . . . . $ 1,253,244 $1,102,832 $ 806,765
Net cash used in investing activities . . . . . . . . . . . . . . . . . . . . . . . $ (96,324) $ (700,688) $ (97,319)
Net cash used in financing activities . . . . . . . . . . . . . . . . . . . . . . . $(1,144,001) $ (788,284) $(962,491)
Free Cash Flow
Net cash provided by operating activities. . . . . . . . . . . . . . . . . . . $ 1,253,244 $1,102,832 $ 806,765
Additions to property and equipment. . . . . . . . . . . . . . . . . . . . . (121,646) (173,617) (97,293)
Purchases of restricted and other investments . . . . . . . . . . . — (1,719) (26)
Return of capital from investment in unconsolidated entity 24,178 — —
Free cash flow. . . . . . . . . . . . . . . . . . . . . . . . . . . . . . . . . . . . . . . . . . . . $ 1,155,776 $ 927,496 $ 709,446
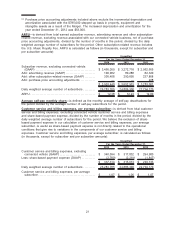
New vehicle consumer conversion rate—is defined as the percentage of owners and lessees of
new vehicles that receive our satellite radio service and convert to become self-paying subscribers
after the initial promotion period. At the time satellite radio enabled vehicles are sold or leased, the
owners or lessees generally receive trial subscriptions ranging from three to twelve months. We
measure conversion rate three months after the period in which the trial service ends. The metric
excludes rental and fleet vehicles.
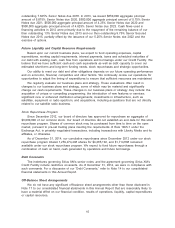
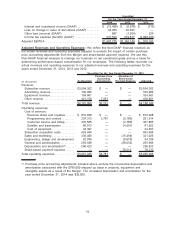
Subscriber acquisition cost, per installation—or SAC, per installation, is derived from subscriber
acquisition costs and margins from the sale of radios and accessories, excluding purchase price
accounting adjustments, divided by the number of satellite radio installations in new vehicles and
shipments of aftermarket radios for the period. Purchase price accounting adjustments associated
with the Merger include the elimination of the benefit of amortization of deferred credits on
executory contracts recognized at the Merger date attributable to an OEM. SAC, per installation, is
calculated as follows (in thousands, except for installation amounts):
2014 2013 2012
For the Years Ended December 31,
Unaudited
Subscriber acquisition costs (GAAP) . . . . . . . . . . . . . . . . . . . $ 493,464 $ 495,610 $ 474,697
Less: margin from direct sales of radios and
accessories (GAAP) . . . . . . . . . . . . . . . . . . . . . . . . . . . . . . . . (60,264) (54,095) (41,690)
Add: purchase price accounting adjustments . . . . . . . . . . . — 64,365 90,503
$ 433,200 $ 505,880 $ 523,510
Installations . . . . . . . . . . . . . . . . . . . . . . . . . . . . . . . . . . . . . . . . . . . 12,787,537 11,765,078 11,061,304
SAC, per installation . . . . . . . . . . . . . . . . . . . . . . . . . . . . . . . . . . $ 34 $ 43 $ 47
22