TCF Bank 2004 Annual Report Download - page 82
Download and view the complete annual report
Please find page 82 of the 2004 TCF Bank annual report below. You can navigate through the pages in the report by either clicking on the pages listed below, or by using the keyword search tool below to find specific information within the annual report.-
 1
1 -
2
-
3
-
4
-
5
-
6
-
7
-
8
-
9
-
10
-
11
-
12
-
13
-
14
-
15
-
16
-
17
-
18
-
19
-
20
-
21
-
22
-
23
-
24
-
25
-
26
-
27
-
28
-
29
-
30
-
31
-
32
-
33
-
34
-
35
-
36
-
37
-
38
-
39
-
40
-
41
-
42
-
43
-
44
-
45
-
46
-
47
-
48
-
49
-
50
-
51
-
52
-
53
-
54
-
55
-
56
-
57
-
58
-
59
-
60
-
61
-
62
-
63
-
64
-
65
-
66
-
67
-
68
-
69
-
70
-
71
-
 72
72 -
 73
73 -
 74
74 -
 75
75 -
 76
76 -
 77
77 -
 78
78 -
 79
79 -
 80
80 -
 81
81 -
 82
82 -
 83
83 -
 84
84 -
 85
85 -
 86
86 -
 87
87 -
 88
88
 |
 |

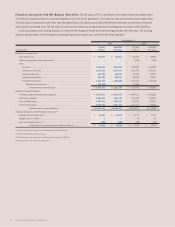
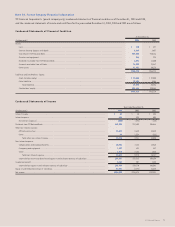
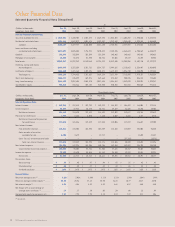
80 TCF Financial Corporation and Subsidiaries
Selected Quarterly Financial Data (Unaudited)
At
(Dollars in thousands, Dec. 31, Sept. 30, June 30, March 31, Dec. 31, Sept. 30, June 30, March 31,
except per-share data) 2004 2004 2004 2004 2003 2003 2003 2003
Selected Financial Condition Data:
Securities available for sale . . . . . . . . . . . . $ 1,619,941 $ 1,330,708 $ 1,588,372 $ 1,269,293 $ 1,533,288 $ 1,604,282 $ 1,980,830 $ 2,442,724
Residential real estate loans . . . . . . . . . . . 1,014,166 1,047,079 1,091,678 1,152,357 1,212,643 1,283,640 1,393,183 1,568,430
Subtotal . . . . . . . . . . . . . . . . . . . . . . . 2,634,107 2,377,787 2,680,050 2,421,650 2,745,931 2,887,922 3,374,013 4,011,154
Loans and leases excluding
residential real estate loans . . . . . . . . 8,372,491 8,025,804 7,776,921 7,470,428 7,135,135 6,863,683 6,705,169 6,485,179
Goodwill . . . . . . . . . . . . . . . . . . . . . . . . . . . 152,599 152,599 152,599 152,599 145,462 145,462 145,462 145,462
Mortgage servicing rights . . . . . . . . . . . . . . 46,442 51,474 51,290 50,726 52,036 49,119 41,379 52,953
Total assets . . . . . . . . . . . . . . . . . . . . . . . . 12,340,567 11,997,949 11,942,863 11,724,319 11,319,015 11,253,906 11,807,764 12,127,272
Checking, savings and money
market deposits . . . . . . . . . . . . . . . . . . . 6,493,545 6,323,659 6,321,761 6,328,757 5,999,626 6,115,863 6,234,447 6,068,095
Certificates of deposit . . . . . . . . . . . . . . . . 1,468,650 1,471,164 1,439,896 1,540,371 1,612,123 1,596,740 1,745,290 1,897,243
Total deposits . . . . . . . . . . . . . . . . . . . 7,962,195 7,794,823 7,761,657 7,869,128 7,611,749 7,712,603 7,979,737 7,965,338
Short-term borrowings . . . . . . . . . . . . . . . . 1,056,111 845,499 869,576 469,663 878,412 900,835 546,118 774,603
Long-term borrowings . . . . . . . . . . . . . . . . . 2,048,492 2,057,608 2,065,870 2,037,424 1,536,413 1,342,890 1,959,921 1,993,287
Stockholders’ equity . . . . . . . . . . . . . . . . . . . 958,418 965,266 939,152 965,950 920,858 931,968 952,069 971,413
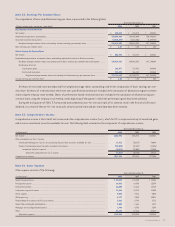
Three Months Ended
(Dollars in thousands, Dec. 31, Sept. 30, June 30, March 31, Dec. 31, Sept. 30, June 30, March 31,
except per-share data) 2004 2004 2004 2004 2003 2003 2003 2003
Selected Operations Data:
Interest income . . . . . . . . . . . . . . . . . . . . . $ 163,388 $ 157,413 $ 152,789 $ 149,219 $ 148,919 $ 156,482 $ 164,004 $ 172,114
Interest expense . . . . . . . . . . . . . . . . . . . . . 36,899 32,923 30,370 30,726 29,827 36,605 44,240 49,702
Net interest income . . . . . . . . . . . . . . . 126,489 124,490 122,419 118,493 119,092 119,877 119,764 122,412
Provision for credit losses . . . . . . . . . . . . . 4,073 2,644 3,070 1,160 4,037 2,658 3,127 2,710
Net interest income after provision
for credit losses . . . . . . . . . . . . . . 122,416 121,846 119,349 117,333 115,055 117,219 116,637 119,702
Non-interest income:
Fees and other revenues . . . . . . . . . . . 126,311 115,803 123,293 102,459 114,865 118,089 101,003 96,835
Gains on sales of securities
available for sale . . . . . . . . . . . . . 6,204 3,679 – 12,717 – – 11,695 21,137
Gains (losses) on termination of debt –––––(37,769) – (6,576)
Total non-interest income . . . . . . 132,515 119,482 123,293 115,176 114,865 80,320 112,698 111,396
Non-interest expense . . . . . . . . . . . . . . . . . 154,396 147,926 143,906 140,706 142,244 142,382 136,733 138,750
Income before income tax expense . . . 100,535 93,402 98,736 91,803 87,676 55,157 92,602 92,348
Income tax expense . . . . . . . . . . . . . . . . . . . 33,133 31,690 33,518 31,142 28,180 19,193 32,311 32,221
Net income . . . . . . . . . . . . . . . . . . . . . $ 67,402 $ 61,712 $ 65,218 $ 60,661 $ 59,496 $ 35,964 $ 60,291 $ 60,127
Per common share:
Basic earnings . . . . . . . . . . . . . . . . . . . $ .50 $ .45 $ .47 $ .44 $ .43 $ .26 $ .43 $ .42
Diluted earnings . . . . . . . . . . . . . . . . . . $ .50 $ .45 $ .47 $ .44 $ .43 $ .26 $ .42 $ .42
Dividends declared . . . . . . . . . . . . . . . $ .1875 $ .1875 $ .1875 $ .1875 $ .1625 $ .1625 $ .1625 $ .1625
Financial Ratios:
Return on average assets(1) . . . . . . . . . . . . 2.22% 2.06% 2.20% 2.11% 2.13% 1.24% 2.04% 1.99%
Return on average common equity(1) . . . . . 28.35 25.96 27.68 25.90 26.18 15.77 25.17 24.70
Net interest margin(1) . . . . . . . . . . . . . . . . . 4.56 4.56 4.53 4.52 4.68 4.57 4.45 4.45
Net charge-offs as a percentage of
average loans and leases(1) . . . . . . . . . .14 .17 .10 .02 .30 .08 .16 .09
Average total equity to average assets . . . 7.81 7.94 7.95 8.13 8.13 7.89 8.11 8.06
(1) Annualized.
Other Financial Data