TCF Bank 2004 Annual Report Download - page 72
Download and view the complete annual report
Please find page 72 of the 2004 TCF Bank annual report below. You can navigate through the pages in the report by either clicking on the pages listed below, or by using the keyword search tool below to find specific information within the annual report.-
 1
1 -
2
-
3
-
4
-
5
-
6
-
7
-
8
-
9
-
10
-
11
-
12
-
13
-
14
-
15
-
16
-
17
-
18
-
19
-
20
-
21
-
22
-
23
-
24
-
25
-
26
-
27
-
28
-
29
-
30
-
31
-
32
-
33
-
34
-
35
-
36
-
37
-
38
-
39
-
40
-
41
-
42
-
43
-
44
-
45
-
46
-
47
-
48
-
49
-
50
-
51
-
52
-
53
-
54
-
55
-
56
-
57
-
58
-
59
-
60
-
61
-
 62
62 -
 63
63 -
 64
64 -
 65
65 -
 66
66 -
 67
67 -
 68
68 -
 69
69 -
 70
70 -
 71
71 -
 72
72 -
 73
73 -
 74
74 -
 75
75 -
 76
76 -
 77
77 -
 78
78 -
 79
79 -
 80
80 -
 81
81 -
 82
82 -
83
-
84
-
85
-
86
-
87
-
88
 |
 |

70 TCF Financial Corporation and Subsidiaries
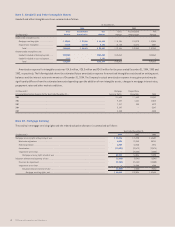
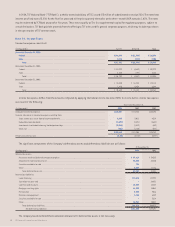
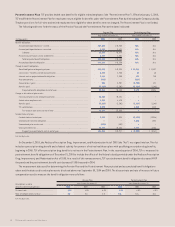
The following table presents assumed health care cost trend rates for the Postretirement Plan at December 31, 2004 and 2003:
2004 2003
Health care cost trend rate assumed for next year . . . . . . . . . . . . . . . . . . . . . . . . . . . . . . . . . . . . . . . . . . . . . . . . . . . . . . . . . . . . . . . . . . . 10% 11%
Final health care cost trend rate . . . . . . . . . . . . . . . . . . . . . . . . . . . . . . . . . . . . . . . . . . . . . . . . . . . . . . . . . . . . . . . . . . . . . . . . . . . . . . 5% 5%
Year that final health care trend rate is reached . . . . . . . . . . . . . . . . . . . . . . . . . . . . . . . . . . . . . . . . . . . . . . . . . . . . . . . . . . . . . . . . . . 2009 2009
Assumed health care cost trend rates have an effect on the amounts reported for the Postretirement Plan. A one-percentage-point change
in assumed health care cost trend rates would have the following effects:
1-Percentage- 1-Percentage-
(In thousands) Point Increase Point Decrease
Effect on total of service and interest cost components . . . . . . . . . . . . . . . . . . . . . . . . . . . . . . . . . . . . . . . . . . . . . . . . . . . . . . . . . . . . $ 26 $ (39)
Effect on postretirement benefits obligations . . . . . . . . . . . . . . . . . . . . . . . . . . . . . . . . . . . . . . . . . . . . . . . . . . . . . . . . . . . . . . . . . . . . . 551 (338)
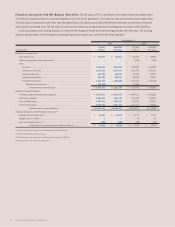
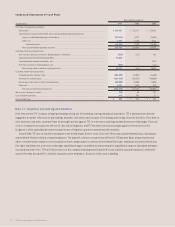
Note 19. Derivative Instruments and Hedging Activities
All derivative instruments as defined, including derivatives embed-
ded in other financial instruments or contracts, are recognized as
either assets or liabilities in the Consolidated Statements of Financial
Condition at fair value. Changes in the fair value of a derivative are
recorded in the Consolidated Statements of Income. TCF had no
derivatives outstanding as of December 31, 2004.
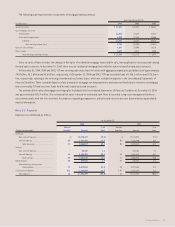
Prior to the restructuring of the residential mortgage banking
operation in 2004, TCF’s pipeline of locked residential mortgage loan
commitments, adjusted for loans not expected to close, and forward
sales contracts were considered derivatives and recorded at fair
value, with the changes in fair value recognized in gains on sales
of loans under mortgage banking revenue in the Consolidated
Statements of Income. TCF also utilized forward sales contracts to
hedge its risk of changes in the fair value, due to changes in interest
rates, of both its locked residential mortgage loan commitments and
its residential loans held for sale. Residential mortgage loans held
for sale were carried at the lower of cost or market as adjusted for
the effects of fair value hedges using quoted market prices. Because
the fair value of the residential loans held for sale were hedged with
forward sales contracts of the same loan types, or substantially the
same loan types, the hedges were highly effective at managing the
risk of changing fair values of such loans. Any differences between
the changes in fair value of the hedged residential loans held for
sale and in the fair value of the forward sales contracts were not
material due to the nature of the hedging instruments and were
recorded in gains on sales of loans. Forward mortgage loan sales
commitments totaled $149.1 million at December 31, 2003.
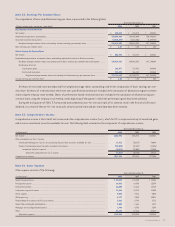
Note 20. Financial Instruments with
Off-Balance-Sheet Risk
TCF is a party to financial instruments with off-balance-sheet risk,
primarily to meet the financing needs of its customers. These finan-
cial instruments, which are issued or held by TCF for purposes other
than trading, involve elements of credit and interest-rate risk in
excess of the amount recognized in the Consolidated Statements
of Financial Condition.
TCF’s exposure to credit loss in the event of non-performance by
the counterparty to the financial instrument for commitments to
extend credit and standby letters of credit is represented by the
contractual amount of the commitments. TCF uses the same credit
policies in making these commitments as it does for on-balance-
sheet instruments. TCF evaluates each customer’s creditworthiness
on a case-by-case basis. The amount of collateral obtained is based
on management’s credit evaluation of the customer.
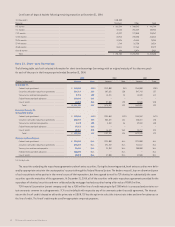
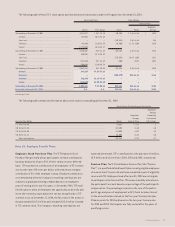
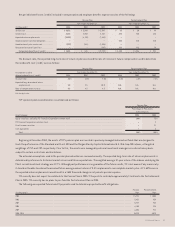
Financial instruments with off-balance sheet risk are summarized as follows:
At December 31,
(In thousands) 2004 2003
Commitments to extend credit:
Consumer . . . . . . . . . . . . . . . . . . . . . . . . . . . . . . . . . . . . . . . . . . . . . . . . . . . . . . . . . . . . . . . . . . . . . . . . . . . . . . . . . . . . . . . . . . . . . . $1,576,381 $1,382,348
Commercial . . . . . . . . . . . . . . . . . . . . . . . . . . . . . . . . . . . . . . . . . . . . . . . . . . . . . . . . . . . . . . . . . . . . . . . . . . . . . . . . . . . . . . . . . . . . . . . . 684,029 624,664
Leasing and equipment finance . . . . . . . . . . . . . . . . . . . . . . . . . . . . . . . . . . . . . . . . . . . . . . . . . . . . . . . . . . . . . . . . . . . . . . . . . . . . . 72,614 57,485
Other . . . . . . . . . . . . . . . . . . . . . . . . . . . . . . . . . . . . . . . . . . . . . . . . . . . . . . . . . . . . . . . . . . . . . . . . . . . . . . . . . . . . . . . . . . . . . . . . . . . . . 55,343 56,007
Total commitments to extend credit . . . . . . . . . . . . . . . . . . . . . . . . . . . . . . . . . . . . . . . . . . . . . . . . . . . . . . . . . . . . . . . . . . . . . . 2,388,367 2,120,504
Loans serviced with recourse . . . . . . . . . . . . . . . . . . . . . . . . . . . . . . . . . . . . . . . . . . . . . . . . . . . . . . . . . . . . . . . . . . . . . . . . . . . . . . . . . 97,568 130,765
Standby letters of credit and guarantees on industrial revenue bonds . . . . . . . . . . . . . . . . . . . . . . . . . . . . . . . . . . . . . . . . . . . . . . . . . . . . . . . . . 75,957 40,796
Total . . . . . . . . . . . . . . . . . . . . . . . . . . . . . . . . . . . . . . . . . . . . . . . . . . . . . . . . . . . . . . . . . . . . . . . . . . . . . . . . . . . . . . . . . . . . . . . . . . . . $2,561,892 $2,292,065