TCF Bank 2004 Annual Report Download - page 75
Download and view the complete annual report
Please find page 75 of the 2004 TCF Bank annual report below. You can navigate through the pages in the report by either clicking on the pages listed below, or by using the keyword search tool below to find specific information within the annual report.-
 1
1 -
2
-
3
-
4
-
5
-
6
-
7
-
8
-
9
-
10
-
11
-
12
-
13
-
14
-
15
-
16
-
17
-
18
-
19
-
20
-
21
-
22
-
23
-
24
-
25
-
26
-
27
-
28
-
29
-
30
-
31
-
32
-
33
-
34
-
35
-
36
-
37
-
38
-
39
-
40
-
41
-
42
-
43
-
44
-
45
-
46
-
47
-
48
-
49
-
50
-
51
-
52
-
53
-
54
-
55
-
56
-
57
-
58
-
59
-
60
-
61
-
62
-
63
-
64
-
 65
65 -
 66
66 -
 67
67 -
 68
68 -
 69
69 -
 70
70 -
 71
71 -
 72
72 -
 73
73 -
 74
74 -
 75
75 -
 76
76 -
 77
77 -
 78
78 -
 79
79 -
 80
80 -
 81
81 -
 82
82 -
 83
83 -
 84
84 -
 85
85 -
86
-
87
-
88
 |
 |

2004 Annual Report 73
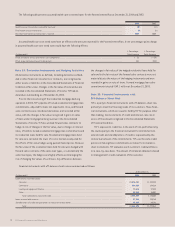
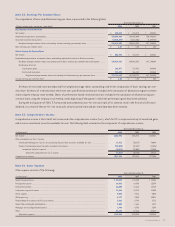
Note 22. Earnings Per Common Share
The computation of basic and diluted earnings per share is presented in the following table:
Year Ended December 31,
(Dollars in thousands, except per-share data) 2004 2003 2002
Basic Earnings Per Common Share
Net income . . . . . . . . . . . . . . . . . . . . . . . . . . . . . . . . . . . . . . . . . . . . . . . . . . . . . . . . . . . . . . . . . . . . . . . . . . . . . . . $ 254,993 $ 215,878 $ 232,931
Weighted average shares outstanding . . . . . . . . . . . . . . . . . . . . . . . . . . . . . . . . . . . . . . . . . . . . . . . . . . . . . . . . 139,656,829 144,028,040 150,480,642
Unvested restricted stock grants . . . . . . . . . . . . . . . . . . . . . . . . . . . . . . . . . . . . . . . . . . . . . . . . . . . . . . . . . . . . . . . . . . (3,040,397) (3,041,506) (3,289,758)
Weighted average common shares outstanding for basic earnings per common share . . . . . . . . . . . . . . . . . . 136,616,432 140,986,534 147,190,884
Basic earnings per common share . . . . . . . . . . . . . . . . . . . . . . . . . . . . . . . . . . . . . . . . . . . . . . . . . . . . . . . . . . . . . . . $ 1.87 $ 1.53 $ 1.58
Diluted Earnings Per Common Share
Net income . . . . . . . . . . . . . . . . . . . . . . . . . . . . . . . . . . . . . . . . . . . . . . . . . . . . . . . . . . . . . . . . . . . . . . . . . . . . . . . $ 254,993 $ 215,878 $ 232,931
Weighted average number of common shares outstanding adjusted for effect of dilutive securities:
Weighted average common shares outstanding used in basic earnings per common share calculation . . . . . 136,616,432 140,986,534 147,190,884
Net dilutive effect of:
Stock option plans . . . . . . . . . . . . . . . . . . . . . . . . . . . . . . . . . . . . . . . . . . . . . . . . . . . . . . . . . . . . . . . . . . . . 182,577 187,346 248,444
Restricted stock plans . . . . . . . . . . . . . . . . . . . . . . . . . . . . . . . . . . . . . . . . . . . . . . . . . . . . . . . . . . . . . . . . . 375,631 366,848 442,560
Weighted average common shares outstanding for diluted earnings per common share . . . . . . . . . . 137,174,640 141,540,728 147,881,888
Diluted earnings per common share . . . . . . . . . . . . . . . . . . . . . . . . . . . . . . . . . . . . . . . . . . . . . . . . . . . . . . . . . . . $ 1.86 $ 1.53 $ 1.58
All shares of restricted stock are deducted from weighted average shares outstanding used for the computation of basic earnings per com-
mon share. All shares of restricted stock which vest over specified time periods are included in the calculation of diluted earnings per common
share using the treasury stock method. Shares of performance-based restricted stock are included in the calculation of diluted earnings per
common share, using the treasury stock method, at the beginning of the quarter in which the performance goals have been achieved.
During the third quarter of 2004, TCF announced and completed a two-for-one stock split of its common stock in the form of a 100% stock
dividend. As a result of the two-for-one stock split, all prior period share and per share data have been restated.
Note 23. Comprehensive Income
Comprehensive income is the total of net income and other comprehensive income (loss), which for TCF is comprised entirely of unrealized gains
and losses on investment securities available for sale. The following table summarizes the components of comprehensive income:
Year Ended December 31,
(In thousands) 2004 2003 2002
Net income . . . . . . . . . . . . . . . . . . . . . . . . . . . . . . . . . . . . . . . . . . . . . . . . . . . . . . . . . . . . . . . . . . . . . . . . . . . . . . . $254,993 $215,878 $232,931
Other comprehensive (loss) income:
Unrealized holding gains (losses) arising during the period on securities available for sale . . . . . . . . . . . . . 11,522 (30,619) 74,044
Reclassification adjustment for gains included in net income . . . . . . . . . . . . . . . . . . . . . . . . . . . . . . . . . . . . . (22,600) (32,832) (11,536)
Income tax (benefit) expense . . . . . . . . . . . . . . . . . . . . . . . . . . . . . . . . . . . . . . . . . . . . . . . . . . . . . . . . . . (4,011) (23,001) 22,635
Total other comprehensive (loss) income . . . . . . . . . . . . . . . . . . . . . . . . . . . . . . . . . . . . . . . . . . . . (7,067) (40,450) 39,873
Comprehensive income . . . . . . . . . . . . . . . . . . . . . . . . . . . . . . . . . . . . . . . . . . . . . . . . . . . . . . . . . . . . . . . . . . . . . . $247,926 $175,428 $272,804
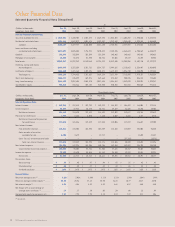
Note 24. Other Expense
Other expense consists of the following:
Year Ended December 31,
(In thousands) 2004 2003 2002
Deposit account losses . . . . . . . . . . . . . . . . . . . . . . . . . . . . . . . . . . . . . . . . . . . . . . . . . . . . . . . . . . . . . . . . . . . . . . $ 22,624 $ 18,820 $ 19,206
Postage and courier . . . . . . . . . . . . . . . . . . . . . . . . . . . . . . . . . . . . . . . . . . . . . . . . . . . . . . . . . . . . . . . . . . . . . . . 14,002 14,358 13,579
Telecommunication . . . . . . . . . . . . . . . . . . . . . . . . . . . . . . . . . . . . . . . . . . . . . . . . . . . . . . . . . . . . . . . . . . . . . . . . . . 12,459 12,634 12,738
Card processing and issuance . . . . . . . . . . . . . . . . . . . . . . . . . . . . . . . . . . . . . . . . . . . . . . . . . . . . . . . . . . . . . . . . . . 12,446 12,213 11,095
Office supplies . . . . . . . . . . . . . . . . . . . . . . . . . . . . . . . . . . . . . . . . . . . . . . . . . . . . . . . . . . . . . . . . . . . . . . . . . . . . . . 9,891 9,316 9,023
ATM processing . . . . . . . . . . . . . . . . . . . . . . . . . . . . . . . . . . . . . . . . . . . . . . . . . . . . . . . . . . . . . . . . . . . . . . . . . . . . . . . . . . . . . . 9,171 9,545 10,071
Federal deposit insurance and OCC assessments . . . . . . . . . . . . . . . . . . . . . . . . . . . . . . . . . . . . . . . . . . . . . . . . . . . . . . . . . . 2,682 2,796 2,761
Deposit base intangible amortization . . . . . . . . . . . . . . . . . . . . . . . . . . . . . . . . . . . . . . . . . . . . . . . . . . . . . . . . . . . . . 1,662 1,666 1,671
Mortgage servicing liquidation expense . . . . . . . . . . . . . . . . . . . . . . . . . . . . . . . . . . . . . . . . . . . . . . . . . . . . . . . . 1,460 4,352 2,394
Other . . . . . . . . . . . . . . . . . . . . . . . . . . . . . . . . . . . . . . . . . . . . . . . . . . . . . . . . . . . . . . . . . . . . . . . . . . . . . . . . . . . . . . . . . 55,743 57,646 57,431
Total other expense . . . . . . . . . . . . . . . . . . . . . . . . . . . . . . . . . . . . . . . . . . . . . . . . . . . . . . . . . . . . . . . . . . . . $142,140 $143,346 $139,969