TCF Bank 2004 Annual Report Download - page 39
Download and view the complete annual report
Please find page 39 of the 2004 TCF Bank annual report below. You can navigate through the pages in the report by either clicking on the pages listed below, or by using the keyword search tool below to find specific information within the annual report.-
 1
1 -
2
-
3
-
4
-
5
-
6
-
7
-
8
-
9
-
10
-
11
-
12
-
13
-
14
-
15
-
16
-
17
-
18
-
19
-
20
-
21
-
22
-
23
-
24
-
25
-
26
-
27
-
28
-
 29
29 -
 30
30 -
 31
31 -
 32
32 -
 33
33 -
 34
34 -
 35
35 -
 36
36 -
 37
37 -
 38
38 -
 39
39 -
 40
40 -
 41
41 -
 42
42 -
 43
43 -
 44
44 -
 45
45 -
 46
46 -
 47
47 -
 48
48 -
 49
49 -
50
-
51
-
52
-
53
-
54
-
55
-
56
-
57
-
58
-
59
-
60
-
61
-
62
-
63
-
64
-
65
-
66
-
67
-
68
-
69
-
70
-
71
-
72
-
73
-
74
-
75
-
76
-
77
-
78
-
79
-
80
-
81
-
82
-
83
-
84
-
85
-
86
-
87
-
88
 |
 |

2004 Annual Report 37
can be reached regarding TCF or for purposes of making comparisons
to other companies. Most of TCF’s non-performing assets and past
due loans and leases are secured by residential real estate. Given the
nature of these assets and the related mortgage foreclosure, property
sale and, if applicable, mortgage insurance claims processes, it can
take 18 months or longer for a loan to migrate from initial delinquency
to final disposition. This resolution process generally takes much
longer for loans secured by real estate than for unsecured loans or
loans secured by other property primarily due to state foreclosure laws.
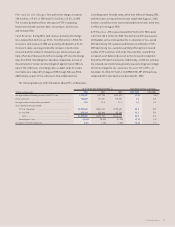
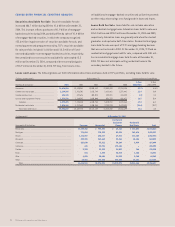
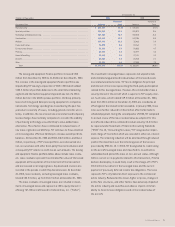
The key indicators of TCF’s credit quality and reserve coverage
for 2004 include the ratio of net charge-offs to average loans and
leases of .11%, the year-end allowance as a multiple of net charge-
offs of 8.4X, and income before income taxes and provision for loan
losses as a multiple of net charge-offs of 41.7X.
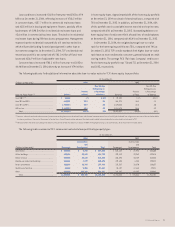
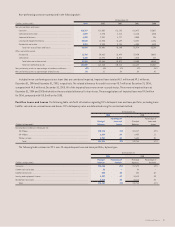
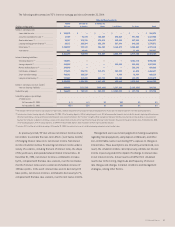
The following table sets forth information detailing the allowance for loan and lease losses and selected key indicators:
Year Ended December 31,
(Dollars in thousands) 2004 2003 2002 2001 2000
Balance at beginning of year . . . . . . . . . . . . . . . . . . . . . . . . . . . . . . . $ 76,619 $ 77,008 $ 75,028 $ 66,669 $ 55,755
Charge-offs:
Consumer . . . . . . . . . . . . . . . . . . . . . . . . . . . . . . . . . . . . . . . . . . . . (4,821) (5,362) (6,939) (6,605) (7,041)
Commercial real estate . . . . . . . . . . . . . . . . . . . . . . . . . . . . . . . . . (602) (1,381) (2,181) (122) (76)
Commercial business . . . . . . . . . . . . . . . . . . . . . . . . . . . . . . . . . . . (235) (920) (5,952) (429) (143)
Leasing and equipment finance . . . . . . . . . . . . . . . . . . . . . . . . . . (8,508) (8,620) (9,230) (9,794) (2,426)
Residential real estate . . . . . . . . . . . . . . . . . . . . . . . . . . . . . . . . (81) (86) (59) (1) (15)
(14,247) (16,369) (24,361) (16,951) (9,701)
Recoveries:
Consumer . . . . . . . . . . . . . . . . . . . . . . . . . . . . . . . . . . . . . . . . . . . . 1,589 2,173 2,965 3,487 4,576
Commercial real estate . . . . . . . . . . . . . . . . . . . . . . . . . . . . . . . . . 126 45 43 103 295
Commercial business . . . . . . . . . . . . . . . . . . . . . . . . . . . . . . . . . . . 82 138 54 193 690
Leasing and equipment finance . . . . . . . . . . . . . . . . . . . . . . . . . . 2,963 1,083 1,264 649 254
Residential real estate . . . . . . . . . . . . . . . . . . . . . . . . . . . . . . . . 899 –28
4,768 3,448 4,335 4,432 5,843
Net charge-offs . . . . . . . . . . . . . . . . . . . . . . . . . . . . . . . . . . (9,479) (12,921) (20,026) (12,519) (3,858)
Provision charged to operations . . . . . . . . . . . . . . . . . . . . . . . . . . . . . 10,947 12,532 22,006 20,878 14,772
Acquired allowance . . . . . . . . . . . . . . . . . . . . . . . . . . . . . . . . . . . . . . 1,791 ––––
Balance at end of year . . . . . . . . . . . . . . . . . . . . . . . . . . . . . . . . . . . . . $ 79,878 $ 76,619 $ 77,008 $ 75,028 $ 66,669
Key Indicators:
Ratio of net loan and lease charge-offs to average loans
and leases outstanding . . . . . . . . . . . . . . . . . . . . . . . . . . . . . . . . .11% .16% .25% .15% .05%
Year-end allowance as a multiple of net charge-offs . . . . . . . . . . . . . 8.4X 5.9X 3.8X 6.0X 17.3X
Income before income taxes and provision for loan losses
as a multiple of net charge-offs . . . . . . . . . . . . . . . . . . . . . . . . . 41.7X 26.3X 19.0X 28.0X 82.3X
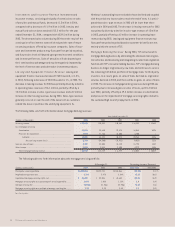
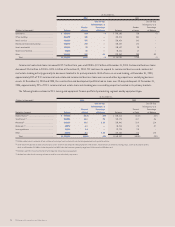
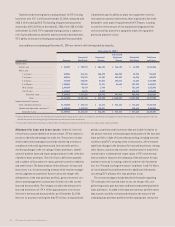
The allocation of TCF’s allowance for loan and lease losses is as follows:
Allocations as a Percentage of Total
Loans and Leases Outstanding by Type
At December 31, At December 31,
(Dollars in thousands) 2004 2003 2002 2001 2000 2004 2003 2002 2001 2000
Consumer . . . . . . . . . . . . . . . . . . . . . . . . . . . . . $ 9,939 $ 9,084 $ 8,532 $ 8,355 $ 9,764 .22% .25% .28% .33% .44%
Commercial real estate . . . . . . . . . . . . . . . . . 20,742 25,142 22,176 24,459 20,753 .96 1.31 1.21 1.51 1.51
Commercial business . . . . . . . . . . . . . . . . . . . 7,696 11,797 15,910 12,117 9,668 1.81 2.76 3.62 2.87 2.36
Leasing and equipment finance . . . . . . . . . . . 24,566 13,515 12,881 11,774 7,583 1.79 1.16 1.24 1.23 .89
Unallocated . . . . . . . . . . . . . . . . . . . . . . . . 16,139 16,139 16,139 16,139 16,139 N.A. N.A. N.A. N.A. N.A.
Subtotal . . . . . . . . . . . . . . . . . . . . . . . . . . . . 79,082 75,677 75,638 72,844 63,907 .94 1.06 1.20 1.32 1.31
Residential real estate . . . . . . . . . . . . . . . . . 796 942 1,370 2,184 2,762 .08 .08 .08 .08 .08
Total allowance balance . . . . . . . . . . . . . $79,878 $76,619 $77,008 $75,028 $66,669 .85 .92 .95 .91 .78
N.A. Not Applicable.