TCF Bank 2004 Annual Report Download - page 35
Download and view the complete annual report
Please find page 35 of the 2004 TCF Bank annual report below. You can navigate through the pages in the report by either clicking on the pages listed below, or by using the keyword search tool below to find specific information within the annual report.-
 1
1 -
2
-
3
-
4
-
5
-
6
-
7
-
8
-
9
-
10
-
11
-
12
-
13
-
14
-
15
-
16
-
17
-
18
-
19
-
20
-
21
-
22
-
23
-
24
-
 25
25 -
 26
26 -
 27
27 -
 28
28 -
 29
29 -
 30
30 -
 31
31 -
 32
32 -
 33
33 -
 34
34 -
 35
35 -
 36
36 -
 37
37 -
 38
38 -
 39
39 -
 40
40 -
 41
41 -
 42
42 -
 43
43 -
 44
44 -
 45
45 -
46
-
47
-
48
-
49
-
50
-
51
-
52
-
53
-
54
-
55
-
56
-
57
-
58
-
59
-
60
-
61
-
62
-
63
-
64
-
65
-
66
-
67
-
68
-
69
-
70
-
71
-
72
-
73
-
74
-
75
-
76
-
77
-
78
-
79
-
80
-
81
-
82
-
83
-
84
-
85
-
86
-
87
-
88
 |
 |

2004 Annual Report 33
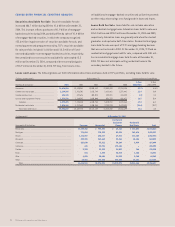
Loans and leases increased $1 billion from year-end 2003 to $9.4
billion at December 31, 2004, reflecting increases of $788.2 million
in consumer loans, $237.7 million in commercial real estate loans
and $215 million in leasing and equipment finance, partially offset
by decreases of $198.5 million in residential real estate loans and
$3.6 million in commercial business loans. The decline in residential
real estate loans during 2004 was due to prepayments. Management
expects that the residential loan portfolio will continue to decline,
which will provide funding for anticipated growth in other loan or
investment categories. At December 31, 2004, TCF’s residential real
estate loan portfolio was comprised of $782.1 million of fixed-rate
loans and $226.9 million of adjustable-rate loans.
Consumer loans increased $788.2 million from year-end 2003 to
$4.4 billion at December 31, 2004, driven by an increase of $794 million
in home equity loans. Approximately 66% of the home equity portfolio
at December 31, 2004 consisted of closed end loans, compared with
70% at December 31, 2003. In addition, at December 31, 2004, 62%
of this portfolio carries a variable interest rate tied to the prime rate,
compared with 60% at December 31, 2003. Outstanding balances on
home equity lines of credit were 49.6% of total lines of credit balances
at December 31, 2004, compared with 45.4% at December 31, 2003.
At December 31, 2004, the weighted average loan-to-value
ratio for the home equity portfolio was 75%, compared with 74% at
December 31, 2003. TCF’s credit standards limit higher loan-to-value
ratio loans to more creditworthy customers, generally based on credit
scoring models. The average FICO (Fair Isaac Company) credit score
for the home equity portfolio was 716 and 711 at December 31,2004
and 2003, respectively.
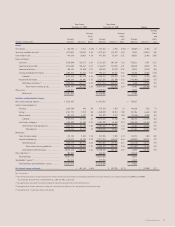
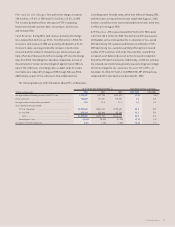
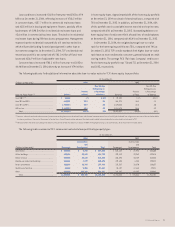
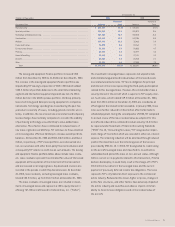
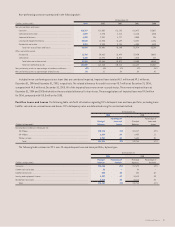
The following table sets forth additional information about the loan-to-value ratios for TCF’s home equity loan portfolio:
At December 31,
(Dollars in thousands) 2004 2003
Over 30-Day Over 30-Day
Delinquency as Delinquency as
Percent a Percentage Percent a Percentage
Loan-to-Value Ratios(1) Balance of Total of Balance Balance of Total of Balance
Over 100% (2) . . . . . . . . . . . . . . . . . . . . . . . . . . . $ 32,825 .7% 3.02% $ 39,452 1.1% 4.81%
Over 90% to 100% . . . . . . . . . . . . . . . . . . . . . . . 449,291 10.3 .38 361,374 10.1 .78
Over 80% to 90% . . . . . . . . . . . . . . . . . . . . . . . . 1,750,531 39.9 .32 1,370,523 38.2 .40
80% or less . . . . . . . . . . . . . . . . . . . . . . . . . . . . . 2,149,369 49.1 .32 1,816,678 50.6 .39
Total . . . . . . . . . . . . . . . . . . . . . . . . . . . . . . . $4,382,016 100.0% .35% $3,588,027 100.0% .48%
(1) Loan-to-value is based on the loan amount (current outstanding balance on closed-end loans and the total commitment on lines of credit) plus deferred loan origination costs net of fees and refundable
insurance premiums, if any, plus the amount of senior liens, if any. Property values represent the most recent market value or property tax assessment value known to TCF.
(2) Amount reflects the total outstanding loan balance. The portion of the loan balance in excess of 100% of the property value is substantially less than the amount included above.
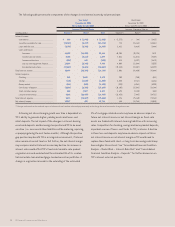
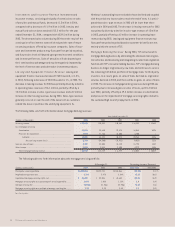
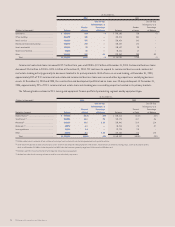
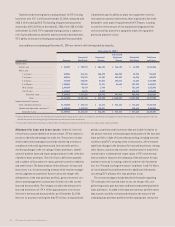
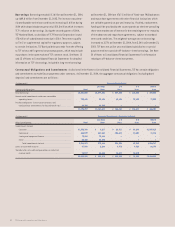
The following tables summarize TCF’s commercial real estate loan portfolio by property type:
At December 31,
2004 2003
Construction Construction
and and
(Dollars in thousands) Permanent Development Total Permanent Development Total
Apartments . . . . . . . . . . . . . . . . . . . . . . . . . . . . . . . $ 524,253 $ 2,795 $ 527,048 $ 519,622 $ 28,983 $ 548,605
Office buildings . . . . . . . . . . . . . . . . . . . . . . . . . . . . 420,874 35,865 456,739 399,112 33,262 432,374
Retail services . . . . . . . . . . . . . . . . . . . . . . . . . . 382,068 28,142 410,210 304,295 10,139 314,434
Warehouse/industrial buildings . . . . . . . . . . . . . 258,561 1,729 260,290 189,635 1,253 190,888
Hotels and motels . . . . . . . . . . . . . . . . . . . . . . 122,236 15,700 137,936 131,367 19,270 150,637
Health care facilities . . . . . . . . . . . . . . . . . . . . 44,344 9,308 53,652 32,157 17,664 49,821
Other . . . . . . . . . . . . . . . . . . . . . . . . . . . . . . . . . . 205,340 103,181 308,521 169,247 60,695 229,942
Total . . . . . . . . . . . . . . . . . . . . . . . . . . . . . . . $1,957,676 $ 196,720 $2,154,396 $1,745,435 $ 171,266 $1,916,701