TCF Bank 2004 Annual Report Download - page 74
Download and view the complete annual report
Please find page 74 of the 2004 TCF Bank annual report below. You can navigate through the pages in the report by either clicking on the pages listed below, or by using the keyword search tool below to find specific information within the annual report.-
 1
1 -
2
-
3
-
4
-
5
-
6
-
7
-
8
-
9
-
10
-
11
-
12
-
13
-
14
-
15
-
16
-
17
-
18
-
19
-
20
-
21
-
22
-
23
-
24
-
25
-
26
-
27
-
28
-
29
-
30
-
31
-
32
-
33
-
34
-
35
-
36
-
37
-
38
-
39
-
40
-
41
-
42
-
43
-
44
-
45
-
46
-
47
-
48
-
49
-
50
-
51
-
52
-
53
-
54
-
55
-
56
-
57
-
58
-
59
-
60
-
61
-
62
-
63
-
 64
64 -
 65
65 -
 66
66 -
 67
67 -
 68
68 -
 69
69 -
 70
70 -
 71
71 -
 72
72 -
 73
73 -
 74
74 -
 75
75 -
 76
76 -
 77
77 -
 78
78 -
 79
79 -
 80
80 -
 81
81 -
 82
82 -
 83
83 -
 84
84 -
85
-
86
-
87
-
88
 |
 |

72 TCF Financial Corporation and Subsidiaries
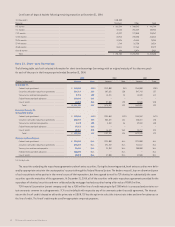
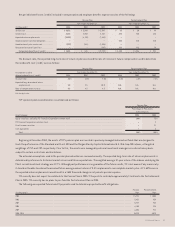
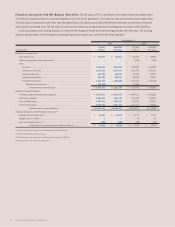
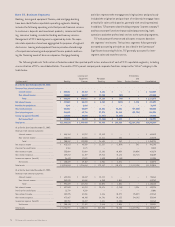
Financial Instruments with Off-Balance-Sheet Risk The fair values of TCF’s commitments to extend credit and standby letters
of credit are estimated using fees currently charged to enter into similar agreements. For fixed-rate loan commitments and standby letters
of credit issued in conjunction with fixed-rate loan agreements, fair value also considers the difference between current levels of interest
rates and the committed rates. The fair value of loans serviced with recourse approximates the carrying value recorded in other liabilities.
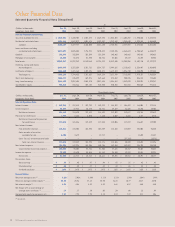
As discussed above, the carrying amounts of certain of the Company’s financial instruments approximate their fair value. The carrying
amounts and fair values of the Company’s remaining financial instruments are set forth in the following table:
At December 31,
2004 2003
Carrying Estimated Carrying Estimated
(In thousands) Amount Fair Value Amount Fair Value
Financial instrument assets:
Loans held for sale . . . . . . . . . . . . . . . . . . . . . . . . . . . . . . . . . . . . . . . . . . . . . . . . . . . . $ 154,279 $ 155,611 $ 335,372 $ 340,189
Forward mortgage loan sales commitments (1) . . . . . . . . . . . . . . . . . . . . . . . . . . . . . . . ––(1,105) (1,105)
Loans:
Consumer . . . . . . . . . . . . . . . . . . . . . . . . . . . . . . . . . . . . . . . . . . . . . . . . . . . . . . . . . . . 4,418,588 4,415,340 3,630,341 3,649,810
Commercial real estate . . . . . . . . . . . . . . . . . . . . . . . . . . . . . . . . . . . . . . . . . . . . . 2,154,396 2,171,409 1,916,701 1,947,267
Commercial business . . . . . . . . . . . . . . . . . . . . . . . . . . . . . . . . . . . . . . . . . . . . . . . 424,135 424,354 427,696 429,727
Equipment finance loans . . . . . . . . . . . . . . . . . . . . . . . . . . . . . . . . . . . . . . . . . . . . 334,352 332,734 309,740 312,948
Residential real estate . . . . . . . . . . . . . . . . . . . . . . . . . . . . . . . . . . . . . . . . . . . . . . . . 1,014,166 1,022,328 1,212,643 1,247,610
Allowance for loan losses(2) . . . . . . . . . . . . . . . . . . . . . . . . . . . . . . . . . . . . . . . . . (58,966) – (67,654) –
Total financial instrument assets . . . . . . . . . . . . . . . . . . . . . . . . . . . . . . . . $ 8,440,950 $ 8,521,776 $ 7,763,734 $ 7,926,446
Financial instrument liabilities:
Checking, savings and money market deposits . . . . . . . . . . . . . . . . . . . . . . . . . . . . . . . . $ 6,493,545 $ 6,493,545 $ 5,999,626 $ 5,999,626
Certificates of deposit . . . . . . . . . . . . . . . . . . . . . . . . . . . . . . . . . . . . . . . . . . . . . . . . . . 1,468,650 1,483,190 1,612,123 1,630,511
Short-term borrowings . . . . . . . . . . . . . . . . . . . . . . . . . . . . . . . . . . . . . . . . . . . . . . . . . . . . . . 1,056,111 1,056,111 878,412 878,412
Long-term borrowings . . . . . . . . . . . . . . . . . . . . . . . . . . . . . . . . . . . . . . . . . . . . . . . . . . . 2,048,492 2,091,412 1,536,413 1,627,253
Total financial instrument liabilities . . . . . . . . . . . . . . . . . . . . . . . . . . . . . $11,066,798 $11,124,258 $10,026,574 $10,135,802
Financial instruments with off-balance-sheet risk:(3)
Commitments to extend credit(4) . . . . . . . . . . . . . . . . . . . . . . . . . . . . . . . . . . . . . . . . . $ 28,551 $ 28,551 $ 22,773 $ 22,773
Standby letters of credit(1) . . . . . . . . . . . . . . . . . . . . . . . . . . . . . . . . . . . . . . . . . . . . . . . . . . . . . . . 8843 43
Loans serviced with recourse(1) . . . . . . . . . . . . . . . . . . . . . . . . . . . . . . . . . . . . . . . . . . . . (100) (100) (100) (100)
Total financial instruments with off-balance-sheet risk . . . . . . . . . . . . . . $ 28,459 $ 28,459 $ 22,716 $ 22,716
(1) Carrying amounts are included in accrued expenses and other liabilities.
(2) Excludes the allowance for lease losses.
(3) Positive amounts represent assets, negative amounts represent liabilities.
(4) Carrying amounts are included in other assets.