TCF Bank 2004 Annual Report Download - page 63
Download and view the complete annual report
Please find page 63 of the 2004 TCF Bank annual report below. You can navigate through the pages in the report by either clicking on the pages listed below, or by using the keyword search tool below to find specific information within the annual report.-
 1
1 -
2
-
3
-
4
-
5
-
6
-
7
-
8
-
9
-
10
-
11
-
12
-
13
-
14
-
15
-
16
-
17
-
18
-
19
-
20
-
21
-
22
-
23
-
24
-
25
-
26
-
27
-
28
-
29
-
30
-
31
-
32
-
33
-
34
-
35
-
36
-
37
-
38
-
39
-
40
-
41
-
42
-
43
-
44
-
45
-
46
-
47
-
48
-
49
-
50
-
51
-
52
-
 53
53 -
 54
54 -
 55
55 -
 56
56 -
 57
57 -
 58
58 -
 59
59 -
 60
60 -
 61
61 -
 62
62 -
 63
63 -
 64
64 -
 65
65 -
 66
66 -
 67
67 -
 68
68 -
 69
69 -
 70
70 -
 71
71 -
 72
72 -
 73
73 -
74
-
75
-
76
-
77
-
78
-
79
-
80
-
81
-
82
-
83
-
84
-
85
-
86
-
87
-
88
 |
 |

2004 Annual Report 61
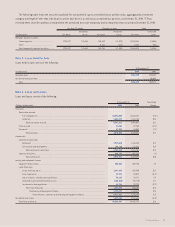
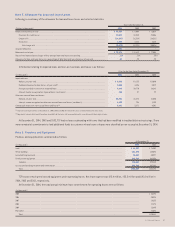
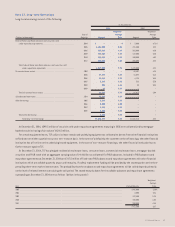
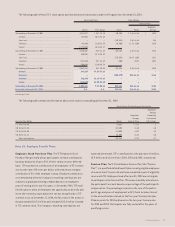
The following table represents the components of mortgage banking revenue:
Year Ended December 31,
(In thousands) 2004 2003 2002
Servicing income . . . . . . . . . . . . . . . . . . . . . . . . . . . . . . . . . . . . . . . . . . . . . . . . . . . . . . . . . . . . . . . . . . . . . . . . . . . . . . . . . $ 17,349 $ 20,533 $ 20,443
Less mortgage servicing:
Amortization . . . . . . . . . . . . . . . . . . . . . . . . . . . . . . . . . . . . . . . . . . . . . . . . . . . . . . . . . . . . . . . . . . . . . . . . . 13,091 23,679 22,874
Provision for impairment . . . . . . . . . . . . . . . . . . . . . . . . . . . . . . . . . . . . . . . . . . . . . . . . . . . . . . . . . . . . . . . . . 1,500 21,154 12,500
Subtotal . . . . . . . . . . . . . . . . . . . . . . . . . . . . . . . . . . . . . . . . . . . . . . . . . . . . . . . . . . . . . . . . . . . . . . . . . 14,591 44,833 35,374
Net servicing income (loss) . . . . . . . . . . . . . . . . . . . . . . . . . . . . . . . . . . . . . . . . . . . . . . . . . . . . . . . . . . . . . 2,758 (24,300) (14,931)
Gains on sales of loans . . . . . . . . . . . . . . . . . . . . . . . . . . . . . . . . . . . . . . . . . . . . . . . . . . . . . . . . . . . . . . . . . . . . . . 8,107 33,505 18,110
Other income . . . . . . . . . . . . . . . . . . . . . . . . . . . . . . . . . . . . . . . . . . . . . . . . . . . . . . . . . . . . . . . . . . . . . . . . . . . . 2,095 3,514 3,800
Total mortgage banking revenue . . . . . . . . . . . . . . . . . . . . . . . . . . . . . . . . . . . . . . . . . . . . . . . . . . . . . . . . $ 12,960 $ 12,719 $ 6,979
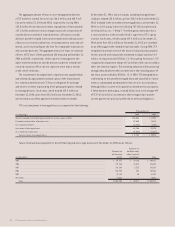
Gains on sales of loans includes the changes in fair value of residential mortgage loans held for sale, loan applications in process and related
forward sales contracts. At December 31, 2004, there were no residential mortgage loans held for sale or related forward sales contracts.
At December 31, 2004, 2003 and 2002, TCF was servicing real estate loans for others with aggregate unpaid principal balances of approximately
$4.5 billion, $5.1 billion and $5.6 billion, respectively. At December 31, 2004 and 2003, TCF had custodial funds of $106.1 million and $128.5 mil-
lion, respectively, relating to the servicing of residential real estate loans, which are included in deposits in the Consolidated Statements of
Financial Condition. These custodial deposits relate primarily to mortgage servicing operations and represent funds due to investors on mortgage
loans serviced by TCF and customer funds held for real estate taxes and insurance.
The estimated fair value of mortgage servicing rights included in the Consolidated Statements of Financial Condition at December 31, 2004
was approximately $55.9 million. The estimated fair value is based on estimated cash flows discounted using rates management believes
are commensurate with the risks involved. Assumptions regarding prepayments, defaults and interest rates are determined using available
market information.
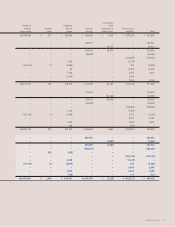
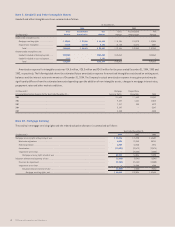
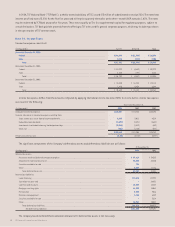
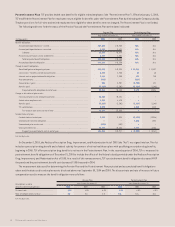
Note 11. Deposits
Deposits are summarized as follows:
At December 31,
2004 2003
Rate at % of Rate at % of
(Dollars in thousands) Year End Amount Total Year End Amount Total
Checking:
Non-interest bearing . . . . . . . . . . . . . . . . . –% $2,378,697 29.9% –% $2,113,572 27.8%
Interest bearing . . . . . . . . . . . . . . . . . . . . . .55 1,527,290 19.2 .08 1,134,840 14.9
Total checking . . . . . . . . . . . . . . . . . . . .22 3,905,987 49.1 .03 3,248,412 42.7
Savings:
Non-interest bearing . . . . . . . . . . . . . . . . . – 89,578 1.1 – 104,104 1.3
Interest bearing . . . . . . . . . . . . . . . . . . . . . .62 1,838,294 23.1 .43 1,801,819 23.7
Total savings . . . . . . . . . . . . . . . . . . . . .59 1,927,872 24.2 .41 1,905,923 25.0
Money market .59 659,686 8.3 .37 845,291 11.1
Total checking, savings, and
money market . . . . . . . . . . . . . . . . . . . .37 6,493,545 81.6 .20 5,999,626 78.8
Certificates of deposit . . . . . . . . . . . . . . . . . . . 2.11 1,468,650 18.4 2.01 1,612,123 21.2
Total deposits . . . . . . . . . . . . . . . . . . . . . . .69 $7,962,195 100.0% .58 $7,611,749 100.0%