TCF Bank 2004 Annual Report Download - page 37
Download and view the complete annual report
Please find page 37 of the 2004 TCF Bank annual report below. You can navigate through the pages in the report by either clicking on the pages listed below, or by using the keyword search tool below to find specific information within the annual report.-
 1
1 -
2
-
3
-
4
-
5
-
6
-
7
-
8
-
9
-
10
-
11
-
12
-
13
-
14
-
15
-
16
-
17
-
18
-
19
-
20
-
21
-
22
-
23
-
24
-
25
-
26
-
 27
27 -
 28
28 -
 29
29 -
 30
30 -
 31
31 -
 32
32 -
 33
33 -
 34
34 -
 35
35 -
 36
36 -
 37
37 -
 38
38 -
 39
39 -
 40
40 -
 41
41 -
 42
42 -
 43
43 -
 44
44 -
 45
45 -
 46
46 -
 47
47 -
48
-
49
-
50
-
51
-
52
-
53
-
54
-
55
-
56
-
57
-
58
-
59
-
60
-
61
-
62
-
63
-
64
-
65
-
66
-
67
-
68
-
69
-
70
-
71
-
72
-
73
-
74
-
75
-
76
-
77
-
78
-
79
-
80
-
81
-
82
-
83
-
84
-
85
-
86
-
87
-
88
 |
 |

2004 Annual Report 35
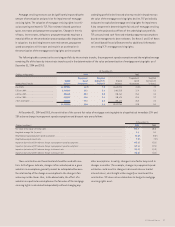
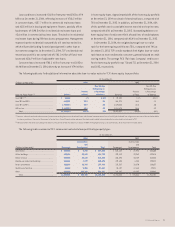
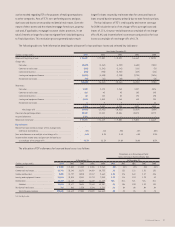
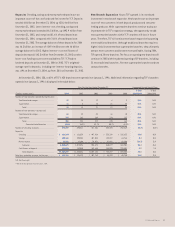
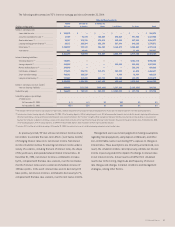
At December 31,
(Dollars in thousands) 2004 2003
Percent of Percent of
Equipment Type Balance Total Balance Total
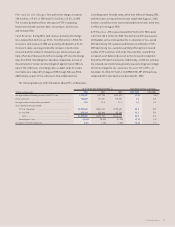
Manufacturing . . . . . . . . . . . . . . . . . . . . . . . . . . . . . . . . . . . . . . . . . . . . . . . . . . . . . . . . . . . . . . $ 251,157 18.2% $ 198,321 17.1%
Specialty vehicles . . . . . . . . . . . . . . . . . . . . . . . . . . . . . . . . . . . . . . . . . . . . . . . . . . . . . . . . 236,582 17.2 225,073 19.4
Technology and data processing . . . . . . . . . . . . . . . . . . . . . . . . . . . . . . . . . . . . . . . . . . . . . 229,160 16.7 249,515 21.5
Construction . . . . . . . . . . . . . . . . . . . . . . . . . . . . . . . . . . . . . . . . . . . . . . . . . . . . . . . . . . . . 182,612 13.3 133,104 11.5
Medical . . . . . . . . . . . . . . . . . . . . . . . . . . . . . . . . . . . . . . . . . . . . . . . . . . . . . . . . . . . . . . . . . 157,745 11.5 33,462 2.9
Trucks and trailers . . . . . . . . . . . . . . . . . . . . . . . . . . . . . . . . . . . . . . . . . . . . . . . . . . . . . . . . . . . . 74,870 5.4 89,262 7.7
Furniture and fixtures . . . . . . . . . . . . . . . . . . . . . . . . . . . . . . . . . . . . . . . . . . . . . . . . . . . . .51,192 3.7 54,052 4.7
Printing . . . . . . . . . . . . . . . . . . . . . . . . . . . . . . . . . . . . . . . . . . . . . . . . . . . . . . . . . . . . . . . . . 45,394 3.3 38,977 3.3
Material handling . . . . . . . . . . . . . . . . . . . . . . . . . . . . . . . . . . . . . . . . . . . . . . . . . . . . . . . . 33,810 2.5 27,111 2.3
Aircraft . . . . . . . . . . . . . . . . . . . . . . . . . . . . . . . . . . . . . . . . . . . . . . . . . . . . . . . . . . . . . . . . . 22,556 1.6 23,965 2.1
Other . . . . . . . . . . . . . . . . . . . . . . . . . . . . . . . . . . . . . . . . . . . . . . . . . . . . . . . . . . . . . . . . . . . . 90,294 6.6 87,555 7.5
Total . . . . . . . . . . . . . . . . . . . . . . . . . . . . . . . . . . . . . . . . . . . . . . . . . . . . . . . . . . . . . . . . . $1,375,372 100.0% $1,160,397 100.0%
The leasing and equipment finance portfolio increased $215
million from December 31, 2003 to $1.4 billion at December 31, 2004.
This increase in the leasing and equipment finance portfolio was
impacted by TCF Leasing’s acquisition of VGM in 2004 which added
$103.2 million of portfolio balances to the small ticket marketing
segment and the medical equipment type and was net of a $28.6
million decline in the Winthrop lease portfolio. Winthrop primarily
leases technology and data processing equipment to companies
nationwide. Technology spending has slowed during the past few
years due to a variety of issues, including general economic uncer-
tainty. In addition, the low interest rate environment and temporary
tax law changes have led many companies to consider the viability
of purchasing technology versus Winthrop’s value-added lease
alternative. These factors have contributed to reduced levels of
new lease originations at Winthrop. TCF continues to focus attention
on increasing sales efforts at Winthrop to increase overall portfolio
balances. At December 31, 2004 and 2003, $48.5 million, and $66.4
million, respectively, of TCF’s lease portfolio, were discounted on a
non-recourse basis with other third-party financial institutions and
consequently TCF retains no
credit risk on such amounts. The leasing
and equipment finance portfolio tables above include lease residu-
als. Lease residuals represent the estimated fair value of the leased
equipment at the expiration
of the initial term of the transaction
and are reviewed on an ongoing basis. Any downward revisions are
recorded in the periods in which they become known. At December
31, 2004, lease residuals, excluding leveraged lease residuals,
totaled $35.2 million, up from $34.2 million at December 31, 2003.
The lease residuals on leveraged leases are included in invest-
ments in leveraged leases and represent a 100% equity interest in
a Boeing 767-300 aircraft leased to Delta Airlines, Inc. (“Delta”).
The investment in leveraged leases represents net unpaid rentals
and estimated unguaranteed residual values of the leased assets
less related unearned income. TCF has no obligation for principal
and interest on the notes representing the third-party participation
related to this leveraged lease. However, these noteholders have a
security interest in the aircraft which is superior to TCF’s equity inter-
est. Such notes, which totaled $19.2 million at December 31, 2004,
down from $22.6 million at December 31, 2003, are recorded as an
offset against the related rental receivable. In January 2005, these
notes were further reduced to $15.6 million after Delta made its
scheduled payment. During the second quarter of 2004, TCF completed
its annual review of the lease residual value assumption for this
aircraft and reduced the estimated residual value by $4.4 million.
As required under Statement of Financial Accounting Standards
(“SFAS”) No.13, “Accounting for Leases,” TCF recognized an impair-
ment charge of $1.6 million which was recorded in other non-interest
expense. The remaining reduction will be amortized through reduced
yield on the investment over the remaining years of the lease as
prescribed by SFAS No.13. In 2004, TCF downgraded its credit rating
on the aircraft leveraged lease and classified its investment as
substandard and placed the lease on non-accrual status. Although
Delta is current on its payments related to this transaction, if Delta
declares bankruptcy, it would likely result in the charge-off of TCF’s
$18.8 million investment in the leveraged lease and the current
payment of previously deferred income tax obligations. This lease
represents TCF’s only material direct exposure to the commercial
airline industry. Reduced airline travel, higher oil prices, changes in
airline fare structures, and other factors have adversely impacted
the airline industry and could have an adverse impact on Delta’s
ability to meet its lease obligations and on the residual value of
the aircraft.