TCF Bank 2004 Annual Report Download - page 34
Download and view the complete annual report
Please find page 34 of the 2004 TCF Bank annual report below. You can navigate through the pages in the report by either clicking on the pages listed below, or by using the keyword search tool below to find specific information within the annual report.-
 1
1 -
2
-
3
-
4
-
5
-
6
-
7
-
8
-
9
-
10
-
11
-
12
-
13
-
14
-
15
-
16
-
17
-
18
-
19
-
20
-
21
-
22
-
23
-
 24
24 -
 25
25 -
 26
26 -
 27
27 -
 28
28 -
 29
29 -
 30
30 -
 31
31 -
 32
32 -
 33
33 -
 34
34 -
 35
35 -
 36
36 -
 37
37 -
 38
38 -
 39
39 -
 40
40 -
 41
41 -
 42
42 -
 43
43 -
 44
44 -
45
-
46
-
47
-
48
-
49
-
50
-
51
-
52
-
53
-
54
-
55
-
56
-
57
-
58
-
59
-
60
-
61
-
62
-
63
-
64
-
65
-
66
-
67
-
68
-
69
-
70
-
71
-
72
-
73
-
74
-
75
-
76
-
77
-
78
-
79
-
80
-
81
-
82
-
83
-
84
-
85
-
86
-
87
-
88
 |
 |

32 TCF Financial Corporation and Subsidiaries
CONSOLIDATED FINANCIAL CONDITION ANALYSIS
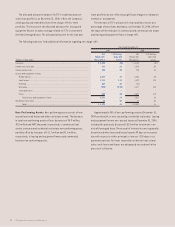
Securities Available for Sale Securities available for sale
increased $86.7 million during 2004 to $1.6 billion at December 31,
2004. This increase reflects purchases of $1.9 billion of mortgage-
backed securities during 2004, partially offset by sales of $1.4 billion
of mortgage-backed securities, in which the company recognized
$22.6 million in gains on sales of securities available for sale, and
normal payment and prepayment activity. TCF’s securities available
for sale portfolio included $1.6 billion and $10.2 million of fixed-
rate and adjustable-rate mortgage-backed securities, respectively.
Net unrealized losses on securities available for sale totaled $2.2
million at December 31, 2004, compared with net unrealized gains
of $8.9 million at December 31, 2003. TCF may, from time to time,
sell additional mortgage-backed securities and utilize the proceeds
to either reduce borrowings or to fund growth in loans and leases.
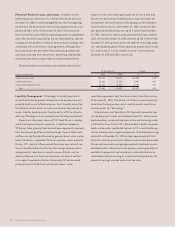
Loans Held for Sale Loans held for sale includes education
and residential mortgage loans. Education loans held for sale were
$154.3 million and $234.3 million at December 31, 2004 and 2003,
respectively. Education loans are generally sold when the student
graduates or drops below half-time status. Residential mortgage
loans held for sale were part of TCF’s mortgage banking business
that was restructured in 2004. At December 31, 2004, TCF had no
residential mortgage loans held for sale, compared with $101 mil-
lion in residential mortgage loans held for sale at December 31,
2003. TCF does not anticipate selling residential loans in the
secondary market in the future.
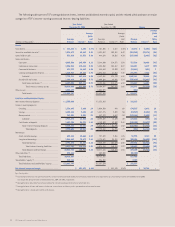
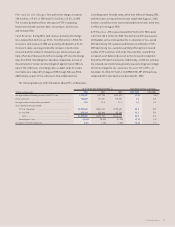
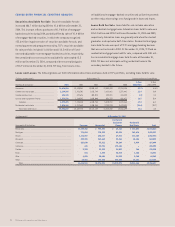
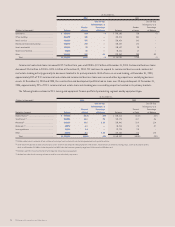
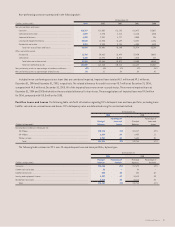
Loans and Leases The following tables set forth information about loans and leases held in TCF’s portfolio, excluding loans held for sale:
(Dollars in thousands) At December 31, Compound Annual Growth Rate
1-Year 5-Year
Portfolio Distribution: 2004 2003 2002 2001 2000 2004/2003 2004/1999
Consumer . . . . . . . . . . . . . . . . . . . . . . . . . . . . . . . $4,418,588 $3,630,341 $3,005,882 $2,509,333 $2,234,134 21.7% 16.5%
Commercial real estate . . . . . . . . . . . . . . . . . . . . 2,154,396 1,916,701 1,835,788 1,622,461 1,371,841 12.4 14.9
Commercial business . . . . . . . . . . . . . . . . . . . . . . 424,135 427,696 440,074 422,381 410,422 (.8) 3.8
Leasing and equipment finance . . . . . . . . . . . . . 1,375,372 1,160,397 1,039,040 956,737 856,471 18.5 22.8
Subtotal . . . . . . . . . . . . . . . . . . . . . . . . . . . . . 8,372,491 7,135,135 6,320,784 5,510,912 4,872,868 17.3 16.1
Residential real estate . . . . . . . . . . . . . . . . . . . 1,014,166 1,212,643 1,800,344 2,733,290 3,673,831 (16.4) (23.7)
Total loans and leases . . . . . . . . . . . . . . . . . $9,386,657 $8,347,778 $8,121,128 $8,244,202 $8,546,699 12.4 3.5
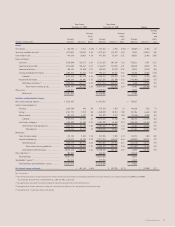
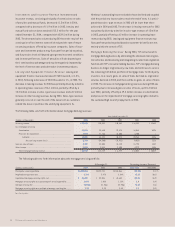
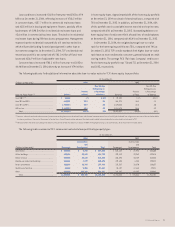
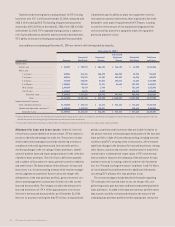
(In thousands) At December 31, 2004
Leasing and
Equipment Residential
Geographic Distribution: Consumer Commercial Finance Real Estate Total
Minnesota . . . . . . . . . . . . . . . . . . . . . . . . . . . . . . . . . . . . . . . . . . . . . $1,789,382 $ 733,203 $ 63,624 $ 517,854 $3,104,063
Michigan . . . . . . . . . . . . . . . . . . . . . . . . . . . . . . . . . . . . . . . . . . . . . . . . 776,654 770,265 89,694 261,678 1,898,291
Illinois . . . . . . . . . . . . . . . . . . . . . . . . . . . . . . . . . . . . . . . . . . . . . . . . 1,151,067 430,477 47,926 173,103 1,802,573
Wisconsin . . . . . . . . . . . . . . . . . . . . . . . . . . . . . . . . . . . . . . . . . . . . . . . . 429,725 369,669 35,361 28,104 862,859
Colorado . . . . . . . . . . . . . . . . . . . . . . . . . . . . . . . . . . . . . . . . . . . . . . . . 227,630 33,521 30,284 6,459 297,894
California . . . . . . . . . . . . . . . . . . . . . . . . . . . . . . . . . . . . . . . . . . . . . . . . 645 22,794 175,154 – 198,593
Florida . . . . . . . . . . . . . . . . . . . . . . . . . . . . . . . . . . . . . . . . . . . . . . . . . . . . . . . 9,350 23,245 94,891 744 128,230
Texas . . . . . . . . . . . . . . . . . . . . . . . . . . . . . . . . . . . . . . . . . . . . . . . . . 474 1,339 88,919 1,200 91,932
Ohio . . . . . . . . . . . . . . . . . . . . . . . . . . . . . . . . . . . . . . . . . . . . . . . . . . . . . . . . 4,698 20,488 54,019 5,760 84,965
Other . . . . . . . . . . . . . . . . . . . . . . . . . . . . . . . . . . . . . . . . . . . . . . . . . 28,963 173,530 695,500 19,264 917,257
Total . . . . . . . . . . . . . . . . . . . . . . . . . . . . . . . . . . . . . . . . . . . . . . $4,418,588 $2,578,531 $1,375,372 $1,014,166 $9,386,657