TCF Bank 2004 Annual Report Download - page 40
Download and view the complete annual report
Please find page 40 of the 2004 TCF Bank annual report below. You can navigate through the pages in the report by either clicking on the pages listed below, or by using the keyword search tool below to find specific information within the annual report.-
 1
1 -
2
-
3
-
4
-
5
-
6
-
7
-
8
-
9
-
10
-
11
-
12
-
13
-
14
-
15
-
16
-
17
-
18
-
19
-
20
-
21
-
22
-
23
-
24
-
25
-
26
-
27
-
28
-
29
-
 30
30 -
 31
31 -
 32
32 -
 33
33 -
 34
34 -
 35
35 -
 36
36 -
 37
37 -
 38
38 -
 39
39 -
 40
40 -
 41
41 -
 42
42 -
 43
43 -
 44
44 -
 45
45 -
 46
46 -
 47
47 -
 48
48 -
 49
49 -
 50
50 -
51
-
52
-
53
-
54
-
55
-
56
-
57
-
58
-
59
-
60
-
61
-
62
-
63
-
64
-
65
-
66
-
67
-
68
-
69
-
70
-
71
-
72
-
73
-
74
-
75
-
76
-
77
-
78
-
79
-
80
-
81
-
82
-
83
-
84
-
85
-
86
-
87
-
88
 |
 |

38 TCF Financial Corporation and Subsidiaries
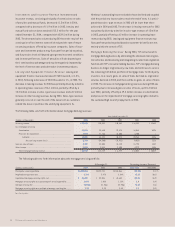
The allocated allowance balances for TCF’s residential and con-
sumer loan portfolios, at December 31, 2004, reflect the Company’s
credit quality and related low level of net charge-offs for these
portfolios. The increase in the allocated allowance for leasing and
equipment finance includes coverage related to TCF’s investment in
the Delta leveraged lease. The allocated allowance for the loan and
lease portfolios do not reflect any significant changes in estimation
methods or assumptions.
The decrease in TCF’s allowance for loan and lease losses as a
percentage of total loans and leases, at December 31, 2004, reflects
the impact of the reduction in commercial and commercial real estate
and leasing and equipment finance charge-offs.
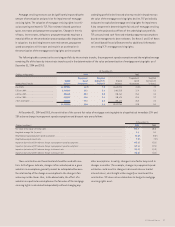
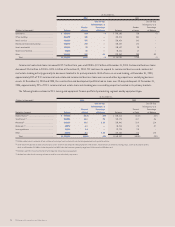
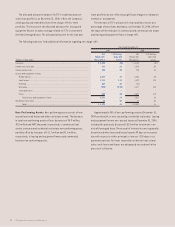
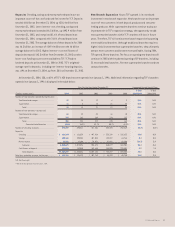
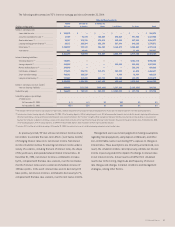
The following table sets forth additional information regarding net charge-offs:
Year Ended December 31,
2004 2003
Net % of Average Net % of Average
Charge-offs Loans and Charge-offs Loans and
(Dollars in thousands) (Recoveries) Leases (Recoveries) Leases
Consumer . . . . . . . . . . . . . . . . . . . . . . . . . . . . . . . . . . . . . . . . . . . . . . . . . . . . . . . . . . . . . . . . . . $ 3,232 .08% $ 3,189 .10%
Commercial real estate . . . . . . . . . . . . . . . . . . . . . . . . . . . . . . . . . . . . . . . . . . . . . . . . . . . . . . . . 476 .02 1,336 .07
Commercial business . . . . . . . . . . . . . . . . . . . . . . . . . . . . . . . . . . . . . . . . . . . . . . . . . . . . . . . . . . 153 .04 782 .18
Leasing and equipment finance:
Middle market . . . . . . . . . . . . . . . . . . . . . . . . . . . . . . . . . . . . . . . . . . . . . . . . . . . . . . . . . . . . . 2,574 .39 1,883 .40
Small ticket . . . . . . . . . . . . . . . . . . . . . . . . . . . . . . . . . . . . . . . . . . . . . . . . . . . . . . . . . . . . . . . 2,787 1.29 1,422 1.28
Winthrop . . . . . . . . . . . . . . . . . . . . . . . . . . . . . . . . . . . . . . . . . . . . . . . . . . . . . . . . . . . . . . 462 .21 (32) –
Wholesale . . . . . . . . . . . . . . . . . . . . . . . . . . . . . . . . . . . . . . . . . . . . . . . . . . . . . . . . . . . . . (782) (0.98) 1,677 1.85
Leveraged leases . . . . . . . . . . . . . . . . . . . . . . . . . . . . . . . . . . . . . . . . . . . . . . . . . . . . . ––––
Other . . . . . . . . . . . . . . . . . . . . . . . . . . . . . . . . . . . . . . . . . . . . . . . . . . . . . . . . . . . . . . . . . . 504 .59 2,587 1.79
Total leasing and equipment finance . . . . . . . . . . . . . . . . . . . . . . . . . . . . . . . . . . . . 5,545 .43 7,537 .69
Residential real estate . . . . . . . . . . . . . . . . . . . . . . . . . . . . . . . . . . . . . . . . . . . . . . . . . . . . 73 .01 77 .01
Total . . . . . . . . . . . . . . . . . . . . . . . . . . . . . . . . . . . . . . . . . . . . . . . . . . . . . . . . . . . . . . . . $ 9,479 .11 $12,921 .16
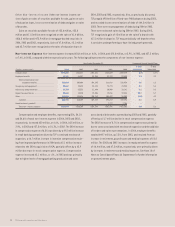
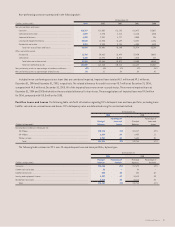
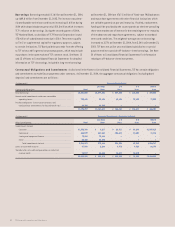
Non-Performing Assets Non-performing assets consist of non-
accrual loans and leases and other real estate owned. The decrease
in total non-performing assets reflects decreases of $8.9 million,
$8.5 million and $692 thousand, respectively, in commercial real
estate, consumer and residential real estate non-performing assets,
partially offset by increases of $11.7 million and $1.6 million,
respectively, in leasing and equipment finance and commercial
business non-performing assets.
Approximately 43% of non-performing assets at December 31,
2004 consisted of, or were secured by, residential real estate. Leasing
and equipment finance non-accrual leases at December 31, 2004,
included the previously discussed $18.8 million investment in an
aircraft leveraged lease. The accrual of interest income is generally
discontinued when loans and leases become 90 days or more past
due with respect to either principal or interest (150 days or six
payments past due for loans secured by residential real estate)
unless such loans and leases are adequately secured and in the
process of collection.