TCF Bank 2004 Annual Report Download - page 71
Download and view the complete annual report
Please find page 71 of the 2004 TCF Bank annual report below. You can navigate through the pages in the report by either clicking on the pages listed below, or by using the keyword search tool below to find specific information within the annual report.-
 1
1 -
2
-
3
-
4
-
5
-
6
-
7
-
8
-
9
-
10
-
11
-
12
-
13
-
14
-
15
-
16
-
17
-
18
-
19
-
20
-
21
-
22
-
23
-
24
-
25
-
26
-
27
-
28
-
29
-
30
-
31
-
32
-
33
-
34
-
35
-
36
-
37
-
38
-
39
-
40
-
41
-
42
-
43
-
44
-
45
-
46
-
47
-
48
-
49
-
50
-
51
-
52
-
53
-
54
-
55
-
56
-
57
-
58
-
59
-
60
-
 61
61 -
 62
62 -
 63
63 -
 64
64 -
 65
65 -
 66
66 -
 67
67 -
 68
68 -
 69
69 -
 70
70 -
 71
71 -
 72
72 -
 73
73 -
 74
74 -
 75
75 -
 76
76 -
 77
77 -
 78
78 -
 79
79 -
 80
80 -
 81
81 -
82
-
83
-
84
-
85
-
86
-
87
-
88
 |
 |

2004 Annual Report 69
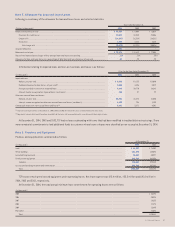
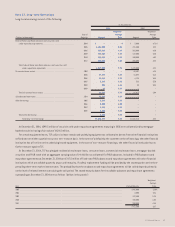
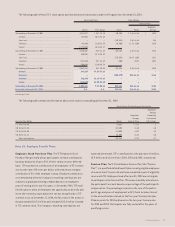
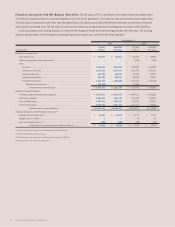
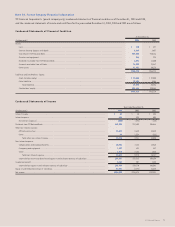
Net periodic benefit cost (credit) included in compensation and employee benefits expense consists of the following:
Pension Plan Postretirement Plan
Year Ended December 31, Year Ended December 31,
(In thousands) 2004 2003 2002 2004 2003 2002
Service cost . . . . . . . . . . . . . . . . . . . . . . . . . . . $ 4,632 $ 3,950 $ 3,547 $53 $ 60 $ 48
Interest cost . . . . . . . . . . . . . . . . . . . . . . . . . . . 3,164 2,950 2,857 672 740 685
Expected return on plan assets . . . . . . . . . . . . . (5,955) (6,374) (7,683) –––
Amortization of transition obligation . . . . . . . . –––210 210 210
Amortization of prior service cost . . . . . . . . . . . (233) (361) (1,056) –––
Recognized actuarial (gain) loss . . . . . . . . . . . –– (387) 215 226 38
Net periodic benefit cost (credit) . . . . . . . $ 1,608 $ 165 $(2,722) $ 1,150 $ 1,236 $ 981
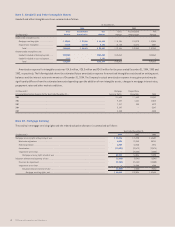
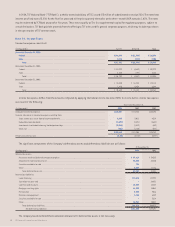
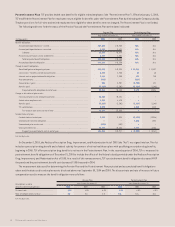
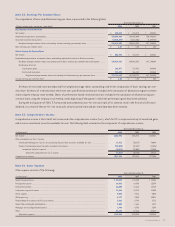
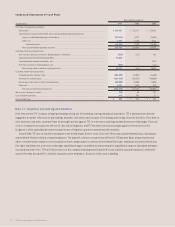
The discount rate, the expected long-term rate of return on plan assets and the rate of increase in future compensation used to determine
the net benefit cost (credit) were as follows:
Pension Plan Postretirement Plan
Assumptions used to Year Ended December 31, Year Ended December 31,
determine benefit cost (credit) 2004 2003 2002 2004 2003 2002
Discount rate . . . . . . . . . . . . . . . . . . . . . . . . . . 6.0% 6.5% 7.5% 6.0% 6.5% 7.5%
Expected long-term rate of return
on plan assets . . . . . . . . . . . . . . . . . . . . . . 8.5 8.5 10.0 N.A. N.A. N.A.
Rate of compensation increase . . . . . . . . . . . . . 4.5 4.5 4.5 N.A. N.A. N.A.
N.A. Not Applicable.
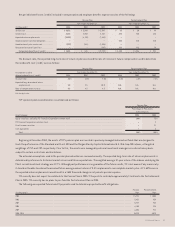
TCF’s pension plan asset allocation is summarized as follows:
Pension Plan
Percentage of Plan Assets
at December 31,
Asset Category 2004 2003
Equity securities, excluding TCF Financial Corporation common stock . . . . . . . . . . . . . . . . . . . . . . . . . . . . . . . . . . . . . . . . . . . . . . . . . . . 100% 75%
TCF Financial Corporation common stock . . . . . . . . . . . . . . . . . . . . . . . . . . . . . . . . . . . . . . . . . . . . . . . . . . . . . . . . . . . . . . . . . . . . . . . . . . . . –2
Fixed-income securities . . . . . . . . . . . . . . . . . . . . . . . . . . . . . . . . . . . . . . . . . . . . . . . . . . . . . . . . . . . . . . . . . . . . . . . . . . . . . . . . . . . . –21
Cash equivalents . . . . . . . . . . . . . . . . . . . . . . . . . . . . . . . . . . . . . . . . . . . . . . . . . . . . . . . . . . . . . . . . . . . . . . . . . . . . . . . . . . . . . . . . . . –2
Total . . . . . . . . . . . . . . . . . . . . . . . . . . . . . . . . . . . . . . . . . . . . . . . . . . . . . . . . . . . . . . . . . . . . . . . . . . . . . . . . . . . . . . . . . . . . . . . . 100% 100%
Beginning in December 2004, the assets of TCF’s pension plan are invested in passively managed index mutual funds that are designed to
track the performance of the Standard and Poor’s 500 and the Morgan Stanley Capital International U.S. Mid-Cap 450 indexes, at targeted
weightings of 75% and 25% respectively. Prior to this, the assets were managed by external investment managers on a discretionary basis
subject to certain restrictions and limitations.
The actuarial assumptions used in the pension plan valuation are reviewed annually. The expected long-term rate of return on plan assets is
determined by reference to historical market returns and future expectations. The weighted average 10-year return of the indexes underlying the
Plan’s current investment strategy was 12.7%. Although past performance is no guarantee of the future results, TCF is not aware of any reasons why
it should not be able to achieve the assumed future average annual returns of 8.5% on plan assets over complete market cycles. A 1% difference in
the expected return on plan assets would result in a $655 thousand change in net periodic pension expense.
TCF currently does not expect to contribute to the Pension Plan in 2005. TCF expects to contribute approximately $1 million to the Postretirement
Plan in 2005. TCF currently has no plans to pre-fund the Postretirement Plan in 2005.
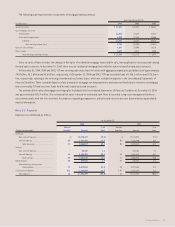
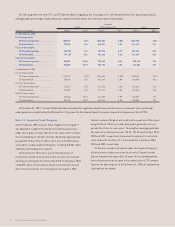
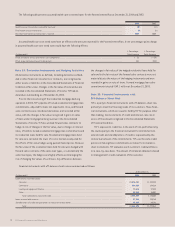
The following are expected future benefit payments used to determine projected benefit obligations:
Pension Postretirement
(In thousands) Plan Plan
2005 . . . . . . . . . . . . . . . . . . . . . . . . . . . . . . . . . . . . . . . . . . . . . . . . . . . . . . . . . . . . . . . . . . . . . . . . . . . . . . . . . . . . . . . . . . . . . . . . . . . . . . . . . . . . $ 5,721 $ 1,004
2006 . . . . . . . . . . . . . . . . . . . . . . . . . . . . . . . . . . . . . . . . . . . . . . . . . . . . . . . . . . . . . . . . . . . . . . . . . . . . . . . . . . . . . . . . . . . . . . . . . . . . . . . . . . . . 5,431 934
2007 . . . . . . . . . . . . . . . . . . . . . . . . . . . . . . . . . . . . . . . . . . . . . . . . . . . . . . . . . . . . . . . . . . . . . . . . . . . . . . . . . . . . . . . . . . . . . . . . . . . . . . . . . . . . 5,787 934
2008 . . . . . . . . . . . . . . . . . . . . . . . . . . . . . . . . . . . . . . . . . . . . . . . . . . . . . . . . . . . . . . . . . . . . . . . . . . . . . . . . . . . . . . . . . . . . . . . . . . . . . . . . . . . . 6,105 926
2009 . . . . . . . . . . . . . . . . . . . . . . . . . . . . . . . . . . . . . . . . . . . . . . . . . . . . . . . . . . . . . . . . . . . . . . . . . . . . . . . . . . . . . . . . . . . . . . . . . . . . . . . . . . . . 6,356 911
2010-2014 . . . . . . . . . . . . . . . . . . . . . . . . . . . . . . . . . . . . . . . . . . . . . . . . . . . . . . . . . . . . . . . . . . . . . . . . . . . . . . . . . . . . . . . . . . . . . . . . . . . . . . . . . 36,325 4,078