TCF Bank 2004 Annual Report Download - page 26
Download and view the complete annual report
Please find page 26 of the 2004 TCF Bank annual report below. You can navigate through the pages in the report by either clicking on the pages listed below, or by using the keyword search tool below to find specific information within the annual report.-
 1
1 -
2
-
3
-
4
-
5
-
6
-
7
-
8
-
9
-
10
-
11
-
12
-
13
-
14
-
15
-
 16
16 -
 17
17 -
 18
18 -
 19
19 -
 20
20 -
 21
21 -
 22
22 -
 23
23 -
 24
24 -
 25
25 -
 26
26 -
 27
27 -
 28
28 -
 29
29 -
 30
30 -
 31
31 -
 32
32 -
 33
33 -
 34
34 -
 35
35 -
 36
36 -
37
-
38
-
39
-
40
-
41
-
42
-
43
-
44
-
45
-
46
-
47
-
48
-
49
-
50
-
51
-
52
-
53
-
54
-
55
-
56
-
57
-
58
-
59
-
60
-
61
-
62
-
63
-
64
-
65
-
66
-
67
-
68
-
69
-
70
-
71
-
72
-
73
-
74
-
75
-
76
-
77
-
78
-
79
-
80
-
81
-
82
-
83
-
84
-
85
-
86
-
87
-
88
 |
 |

24 TCF Financial Corporation and Subsidiaries
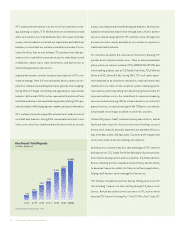
Achieving net interest margin growth over time is dependent on
TCF’s ability to generate higher-yielding assets and lower-cost
retail deposits. The net impact of the changes in interest-bearing
assets and deposits and borrowings has positioned TCF to be asset
sensitive (i.e. more assets than liabilities will be maturing, repricing,
or prepaying during the next twelve months). Although this positive
gap position may benefit TCF in a rising rate environment, if interest
rates remain at current levels or fall further, the net interest margin
may compress and net interest income may decline. An increase in
interest rates would affect TCF’s fixed-rate/variable-rate product
origination mix and would extend the estimated life of its residen-
tial real estate loan and mortgage-backed securities portfolios. A
change in origination mix and/or the extending of the estimated
life of mortgage-related assets may have an adverse impact on
future net interest income or net interest margin as fixed-rate
assets are funded with interest-bearing liabilities with increasing
rates. Competition for checking, savings and money market deposits,
important sources of lower-cost funds for TCF, is intense. A decline
in these low-cost deposits may have an adverse impact on future
net interest income or net interest margin as TCF would need to
replace these funds with short- or long-term borrowings which may
have a higher interest cost. See “Consolidated Financial Condition
Analysis – Market Risk – Interest-Rate Risk” and “Consolidated
Financial Condition Analysis – Deposits” for further discussion on
TCF’s interest rate risk position.
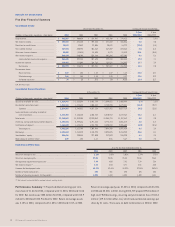
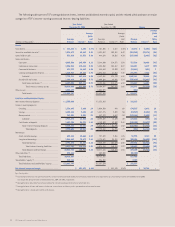
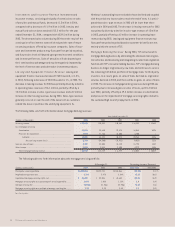
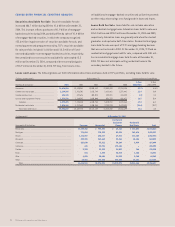
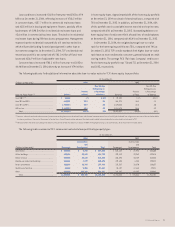
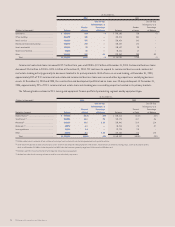
The following table presents the components of the changes in net interest income by volume and rate:
Year Ended Year Ended
December 31, 2004 December 31, 2003
Versus Same Period in 2003 Versus Same Period in 2002
Increase (Decrease) Due to Increase (Decrease) Due to
(In thousands) Volume(1) Rate(1) Total Volume(1) Rate(1) Total
Interest income:
Investments . . . . . . . . . . . . . . . . . . . . . . . . $ 890 $ (1,946) $ (1,056) $ (2,375) $ (48) $ (2,423)
Securities available for sale . . . . . . . . . . . . (18,761) (4,417) (23,178) 713 (15,164) (14,451)
Loans held for sale . . . . . . . . . . . . . . . . . . . (5,775) (2,708) (8,483) 2,421 (4,869) (2,448)
Loans and leases:
Consumer . . . . . . . . . . . . . . . . . . . . . . . 44,623 (14,155) 30,468 40,204 (32,725) 7,479
Commercial real estate . . . . . . . . . . . . 8,743 (7,164) 1,579 7,026 (16,514) (9,488)
Commercial business . . . . . . . . . . . . . . (594) 143 (451) 518 (4,197) (3,679)
Leasing and equipment finance . . . . . 13,597 (6,145) 7,452 8,009 (11,544) (3,535)
Residential real estate . . . . . . . . . . . . (19,557) (5,484) (25,041) (49,442) (13,857) (63,299)
Total interest income . . . . . . . . . . . . . . . . . . . . 13,444 (32,154) (18,710) 1,006 (92,850) (91,844)
Interest expense:
Checking . . . . . . . . . . . . . . . . . . . . . . . . . . . . . 189 2,683 2,872 209 (740) (531)
Savings . . . . . . . . . . . . . . . . . . . . . . . . . . . . . (119) (1,689) (1,808) 2,535 (9,161) (6,626)
Money market . . . . . . . . . . . . . . . . . . . . . . . (566) (889) (1,455) (329) (4,961) (5,290)
Certificates of deposit . . . . . . . . . . . . . . . . (5,508) (8,315) (13,823) (10,602) (15,542) (26,144)
Short-term borrowings . . . . . . . . . . . . . . . . 684 2,529 3,213 2,693 (3,145) (452)
Long-term borrowings . . . . . . . . . . . . . . . . 9,982 (28,437) (18,455) (26,838) (7,883) (34,721)
Total interest expense . . . . . . . . . . . . . . . . . . . . 3,911 (33,367) (29,456) 1,396 (75,160) (73,764)
Net interest income . . . . . . . . . . . . . . . . . . . . . . 10,247 499 10,746 685 (18,765) (18,080)
(1) Changes attributable to the combined impact of volume and rate have been allocated proportionately to the change due to volume and the change due to rate.