TCF Bank 2004 Annual Report Download - page 43
Download and view the complete annual report
Please find page 43 of the 2004 TCF Bank annual report below. You can navigate through the pages in the report by either clicking on the pages listed below, or by using the keyword search tool below to find specific information within the annual report.-
 1
1 -
2
-
3
-
4
-
5
-
6
-
7
-
8
-
9
-
10
-
11
-
12
-
13
-
14
-
15
-
16
-
17
-
18
-
19
-
20
-
21
-
22
-
23
-
24
-
25
-
26
-
27
-
28
-
29
-
30
-
31
-
32
-
 33
33 -
 34
34 -
 35
35 -
 36
36 -
 37
37 -
 38
38 -
 39
39 -
 40
40 -
 41
41 -
 42
42 -
 43
43 -
 44
44 -
 45
45 -
 46
46 -
 47
47 -
 48
48 -
 49
49 -
 50
50 -
 51
51 -
 52
52 -
 53
53 -
54
-
55
-
56
-
57
-
58
-
59
-
60
-
61
-
62
-
63
-
64
-
65
-
66
-
67
-
68
-
69
-
70
-
71
-
72
-
73
-
74
-
75
-
76
-
77
-
78
-
79
-
80
-
81
-
82
-
83
-
84
-
85
-
86
-
87
-
88
 |
 |

2004 Annual Report 41
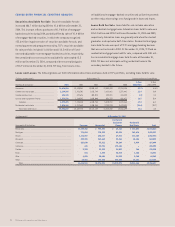
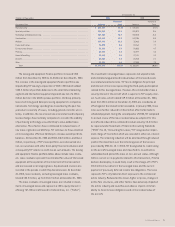
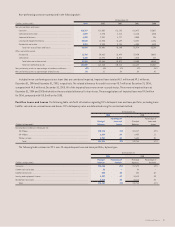
Deposits Checking, savings and money market deposits are an
important source of low cost funds and fee income for TCF. Deposits
totaled $8 billion at December 31, 2004, up $350.4 million from
December 31, 2003. Lower interest-cost checking, savings and
money market deposits totaled $6.5 billion, up $493.9 million from
December 31, 2003, and comprised 81.6% of total deposits at
December 31, 2004, compared with 78.8% of total deposits at
December 31, 2003. The average balance of these deposits for 2004
was $6.3 billion, an increase of $249.4 million over the $6 billion
average balance for 2003. Higher interest-cost certificates of
deposit decreased $143.5 million from December 31, 2003 as other
lower-cost funding sources were available to TCF. TCF had no
brokered deposits at December 31, 2004 or 2003. TCF’s weighted-
average rate for deposits, including non-interest-bearing deposits,
was .69% at December 31, 2004, up from .58% at December 31, 2003.
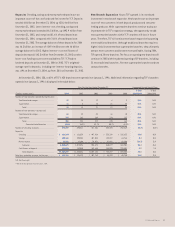
New Branch Expansion Key to TCF’s growth is its continued
investment in new branch expansion. New branches are an important
source of new customers in both deposit products and consumer
lending products. While supermarket branches continue to play an
important role in TCF’s expansion strategy, the opportunity to add
new supermarket branches within TCF’s markets will slow in future
years. Therefore, TCF will continue new branch expansion by opening
more traditional branches. Although traditional branches require a
higher initial investment than supermarket branches, they ultimately
attract more customers and become more profitable. During 2004,
TCF opened 30 new branches. The focus on opening new branches will
continue in 2005 with the planned opening of 29 branches, including
22 new traditional branches, five new supermarket branches and two
campus branches.
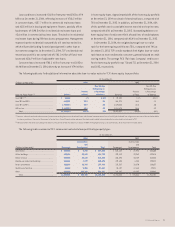
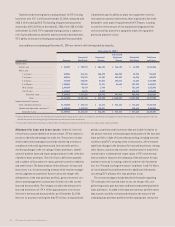
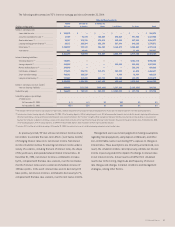
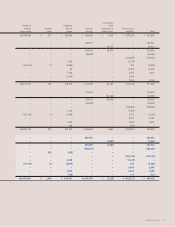
At December 31, 2004, 258, or 60% of TCF’s 430 branches were opened since January 1, 1998. Additional information regarding TCF’s branches
opened since January 1, 1998 is displayed in the table below:
At or For the Year Ended December 31, Compound Annual Growth Rate
1-Year 5-Year
(Dollars in thousands) 2004 2003 2002 2001 2000 2004/2003 2004/1999
Number of new branches opened during the year:
Traditional and campus . . . . . . . . . . . . . . . . 19 14 12 6 3 N.M. N.M.
Supermarket . . . . . . . . . . . . . . . . . . . . . . . . 11 5 15 21 22 N.M. N.M.
Total . . . . . . . . . . . . . . . . . . . . . . . . . . . . . 30 19 27 27 25 N.M. N.M.
Number of new branches*at year end:
Traditional and campus . . . . . . . . . . . . . . . . 61 42 28 16 10 N.M. N.M.
Supermarket . . . . . . . . . . . . . . . . . . . . . . . . 197 186 184 174 153 N.M. N.M.
Total . . . . . . . . . . . . . . . . . . . . . . . . . . . . . 258 228 212 190 163 N.M. N.M.
Percent of total branches . . . . . . . . 60.0% 56.9% 53.7% 50.7% 46.3% N.M. N.M.
Number of checking accounts . . . . . . . . . . . . . . . 575,537 495,211 411,456 342,493 252,469 16.2% 24.5%
Deposits:
Checking . . . . . . . . . . . . . . . . . . . . . . . . . . . $ 868,164 $ 616,539 $ 447,914 $ 335,198 $ 236,633 40.8 43.9
Savings . . . . . . . . . . . . . . . . . . . . . . . . . . . . . 423,165 390,253 407,088 133,987 63,764 8.4 53.4
Money market . . . . . . . . . . . . . . . . . . . . . . . 54,542 66,604 70,476 91,092 68,504 (18.1) 31.8
Subtotal . . . . . . . . . . . . . . . . . . . . . . . . 1,345,871 1,073,396 925,478 560,277 368,901 25.4 45.8
Certificates of deposit . . . . . . . . . . . . . . . . . 156,958 152,050 162,655 184,020 225,401 3.2 2.4
Total deposits . . . . . . . . . . . . . . . . . . . . $1,502,829 $1,225,446 $1,088,133 $ 744,297 $ 594,302 22.6 34.3
Total fees and other revenue for the year . . . . . . $ 153,788 $ 126,123 $ 107,769 $ 85,333 $ 60,750 21.9 31.5
N.M. Not Meaningful.
* New branches opened since January 1, 1998.