TCF Bank 2004 Annual Report Download - page 36
Download and view the complete annual report
Please find page 36 of the 2004 TCF Bank annual report below. You can navigate through the pages in the report by either clicking on the pages listed below, or by using the keyword search tool below to find specific information within the annual report.-
 1
1 -
2
-
3
-
4
-
5
-
6
-
7
-
8
-
9
-
10
-
11
-
12
-
13
-
14
-
15
-
16
-
17
-
18
-
19
-
20
-
21
-
22
-
23
-
24
-
25
-
 26
26 -
 27
27 -
 28
28 -
 29
29 -
 30
30 -
 31
31 -
 32
32 -
 33
33 -
 34
34 -
 35
35 -
 36
36 -
 37
37 -
 38
38 -
 39
39 -
 40
40 -
 41
41 -
 42
42 -
 43
43 -
 44
44 -
 45
45 -
 46
46 -
47
-
48
-
49
-
50
-
51
-
52
-
53
-
54
-
55
-
56
-
57
-
58
-
59
-
60
-
61
-
62
-
63
-
64
-
65
-
66
-
67
-
68
-
69
-
70
-
71
-
72
-
73
-
74
-
75
-
76
-
77
-
78
-
79
-
80
-
81
-
82
-
83
-
84
-
85
-
86
-
87
-
88
 |
 |

34 TCF Financial Corporation and Subsidiaries
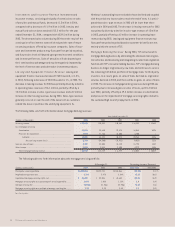
At December 31,
2004 2003
Over 30-Day Over 30-Day
Delinquency as a Delinquency as a
Number Percentage Number Percentage
(Dollars in thousands) Balance of Loans of Balance Balance of Loans of Balance
Apartments . . . . . . . . . . . . . . . . . . . . . . . . . . . . $ 527,048 650 –% $ 548,605 730 –%
Office buildings . . . . . . . . . . . . . . . . . . . . . . . . . 456,739 241 – 432,374 304 –
Retail services . . . . . . . . . . . . . . . . . . . . . . . . . 410,210 375 – 314,434 282 –
Warehouse/industrial buildings . . . . . . . . . . . . 260,290 243 – 190,888 172 –
Hotels and motels . . . . . . . . . . . . . . . . . . . . . . 137,936 35 – 150,637 35 –
Health care facilities . . . . . . . . . . . . . . . . . . . . 53,652 26 – 49,821 17 –
Other . . . . . . . . . . . . . . . . . . . . . . . . . . . . . . . . . . 308,521 292 .01 229,942 200 .03
Total . . . . . . . . . . . . . . . . . . . . . . . . . . . . . . . $2,154,396 1,862 –% $1,916,701 1,740 –%
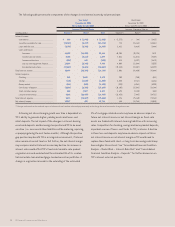
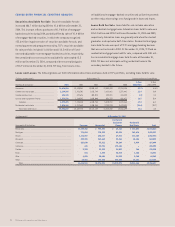
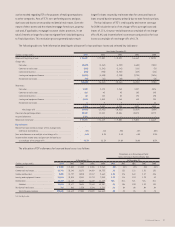
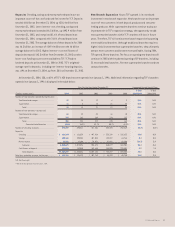
Commercial real estate loans increased $237.7 million from year-end 2003 to $2.2 billion at December 31, 2004. Commercial business loans
decreased $3.6 million in 2004 to $424.1 million at December 31, 2004. TCF continues to expand its commercial business and commercial
real estate lending activity generally to borrowers located in its primary markets. With a focus on secured lending, at December 31, 2004,
approximately 98% of TCF’s commercial real estate and commercial business loans were secured either by properties or underlying business
assets. At December 31, 2004 and 2003, the construction and development portfolio had no loans over 30-days delinquent. At December 31,
2004, approximately 92% of TCF’s commercial real estate loans outstanding were secured by properties located in its primary markets.
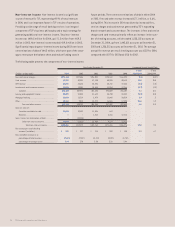
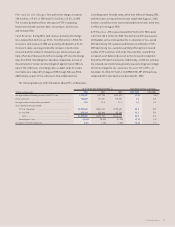
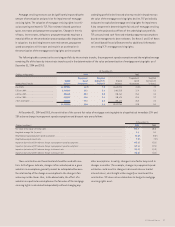
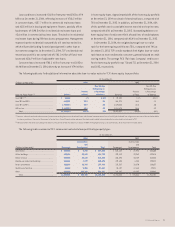
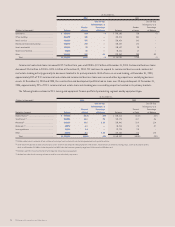
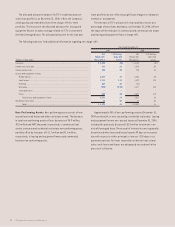
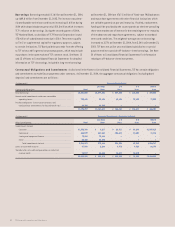
The following tables summarize TCF’s leasing and equipment finance portfolio by marketing segment and by equipment type:
At December 31,
(Dollars in thousands) 2004 2003
Over 30-Day Over 30-Day
Delinquency as a Delinquency as a
Percent Percentage Percent Percentage
Marketing Segment Balance of Total of Balance Balance of Total of Balance
Middle Market(1) . . . . . . . . . . . . . . . . . . . . . . . . . . . . . . $ 747,964 54.3% .51% $ 595,812 51.3% .88%
Small ticket(2) . . . . . . . . . . . . . . . . . . . . . . . . . . . 258,094 18.8 .75 124,178 10.7 .56
Winthrop(3) . . . . . . . . . . . . . . . . . . . . . . . . . . . . . 200,819 14.6 1.10 229,441 19.8 1.14
Wholesale (4) . . . . . . . . . . . . . . . . . . . . . . . . . . . . . 83,913 6.1 – 80,983 7.0 .37
Leveraged leases . . . . . . . . . . . . . . . . . . . . . . . . 18,786 1.4 – 22,728 2.0 –
Other . . . . . . . . . . . . . . . . . . . . . . . . . . . . . . . . . . 65,796 4.8 1.68 107,255 9.2 1.78
Total . . . . . . . . . . . . . . . . . . . . . . . . . . . . . . . $1,375,372 100.0% .67% $1,160,397 100.0% .93%
(1) Middle market consists primarily of loan and lease financing of construction and manufacturing equipment and speciality vehicles.
(2) Small ticket includes loan and lease financings to small- and mid-size companies through programs with vendors, manufacturers, distributors, buying groups, and franchise organizations,
which as of December 31, 2004 includes the portfolio of VGM. Individual contracts generally range from $25 thousand to $250 thousand.
(3) Winthrop’s portfolio consists primarily of technology and data processing equipment.
(4) Wholesale includes the discounting of lease receivables sourced by third party lessors.