TCF Bank 2004 Annual Report Download - page 42
Download and view the complete annual report
Please find page 42 of the 2004 TCF Bank annual report below. You can navigate through the pages in the report by either clicking on the pages listed below, or by using the keyword search tool below to find specific information within the annual report.-
 1
1 -
2
-
3
-
4
-
5
-
6
-
7
-
8
-
9
-
10
-
11
-
12
-
13
-
14
-
15
-
16
-
17
-
18
-
19
-
20
-
21
-
22
-
23
-
24
-
25
-
26
-
27
-
28
-
29
-
30
-
31
-
 32
32 -
 33
33 -
 34
34 -
 35
35 -
 36
36 -
 37
37 -
 38
38 -
 39
39 -
 40
40 -
 41
41 -
 42
42 -
 43
43 -
 44
44 -
 45
45 -
 46
46 -
 47
47 -
 48
48 -
 49
49 -
 50
50 -
 51
51 -
 52
52 -
53
-
54
-
55
-
56
-
57
-
58
-
59
-
60
-
61
-
62
-
63
-
64
-
65
-
66
-
67
-
68
-
69
-
70
-
71
-
72
-
73
-
74
-
75
-
76
-
77
-
78
-
79
-
80
-
81
-
82
-
83
-
84
-
85
-
86
-
87
-
88
 |
 |

40 TCF Financial Corporation and Subsidiaries
Liquidity Management TCF manages its liquidity position to
ensure that the funding needs of depositors and borrowers are met
promptly and in a cost-effective manner. Asset liquidity arises from
the ability to convert assets to cash as well as from the maturity of
assets. Liability liquidity results from the ability of TCF to attract a
diversity of funding sources to promptly meet funding requirements.
Deposits are the primary source of TCF’s funds for use in lending
and for other general business purposes. In addition to deposits,
TCF derives funds primarily from loan and lease repayments, proceeds
from the discounting of leases and borrowings. Deposit inflows and
outflows are significantly influenced by general interest rates, money
market conditions, competition for funds, customer service and other
factors. TCF’s deposit inflows and outflows have been and will con-
tinue to be affected by these factors. Borrowings may be used to
compensate for reductions in normal sources of funds, such as
deposit inflows at less than projected levels, net deposit outflows
or to support expanded activities. Historically, TCF has borrowed
primarily from the FHLB, from institutional sources under
repurchase agreements and, to a lesser extent, from other sources.
At December 31, 2004, TCF had over $2.2 billion in unused capacity
under these funding sources, which could be used to meet future
liquidity needs. See “Borrowings.”
Potential sources of liquidity for TCF Financial Corporation (par-
ent company only) include cash dividends from TCF’s wholly owned
bank subsidiary, issuance of equity securities and borrowings under
a $105 million line of credit. TCF’s National Bank’s ability to pay divi-
dends or make other capital distributions to TCF is restricted by reg-
ulation and may require regulatory approval. Undistributed earnings
and profits at December 31, 2004 includes approximately $134.4
million for which no provision for federal income tax has been made.
This amount represents earnings appropriated to bad debt reserves
and deducted for federal income tax purposes, and is generally not
available for payment of cash dividends or other distributions to
shareholders without incurring an income tax liability based on the
amount of earnings removed and current tax rates.
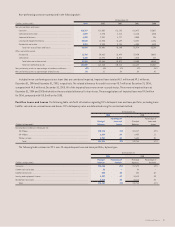
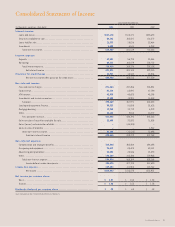
Potential Problem Loans and Leases In addition to non-
performing assets, there were $71.1 million of loans and leases at
December 31, 2004, for which management has concerns regarding
the ability of the borrowers to meet existing repayment terms, com-
pared with $48.1 million at December 31, 2003. These loans and
leases are primarily classified for regulatory purposes as substandard
and reflect the distinct possibility, but not the probability, that the
Company will not be able to collect all amounts due according to the
contractual terms of the loan or lease agreement. Although these
loans and leases have been identified as potential problem loans
and leases, they may never become non-performing. Additionally,
these loans and leases are generally secured by commercial real
estate or assets, thus reducing the potential for loss should they
become non-performing. Potential problem loans and leases are
considered in the determination of the adequacy of the allowance
for loan and lease losses. At December 31, 2004, commercial busi-
ness potential problem loans were up $5.4 million from December
31, 2003. Commercial real estate potential problem loans totaled
$34.1 million at December 31, 2004, and were up $13.9 million from
December 31, 2003, primarily due to the addition of two large proper-
ties. Leasing and equipment finance potential problem loans include
$1.2 million and $1.1 million funded on a non-recourse basis at
December 31, 2004 and 2003, respectively.
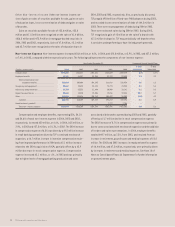
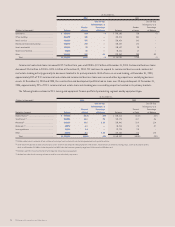
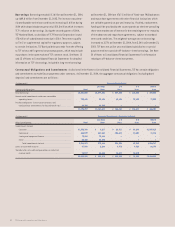
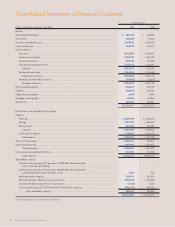
Potential problem loans and leases are summarized as follows:
At December 31, Change
(Dollars in thousands) 2004 2003 $%
Commercial real estate . . . . . . . . . . . . . . . . . . . . . . . . . . . . . . . . . . . . . . . . . . . . . . . . . . . . . . . . $34,138 $20,279 $13,859 68.3%
Commercial business . . . . . . . . . . . . . . . . . . . . . . . . . . . . . . . . . . . . . . . . . . . . . . . . . . . . . . . . . . 18,112 12,721 5,391 42.4
Leasing and equipment finance . . . . . . . . . . . . . . . . . . . . . . . . . . . . . . . . . . . . . . . . . . . . . . . . 18,816 15,094 3,722 24.7
Total . . . . . . . . . . . . . . . . . . . . . . . . . . . . . . . . . . . . . . . . . . . . . . . . . . . . . . . . . . . . . . . . . $71,066 $48,094 $22,972 47.8