Seagate 2011 Annual Report Download - page 92
Download and view the complete annual report
Please find page 92 of the 2011 Seagate annual report below. You can navigate through the pages in the report by either clicking on the pages listed below, or by using the keyword search tool below to find specific information within the annual report.-
 1
1 -
2
-
3
-
4
-
5
-
6
-
7
-
8
-
9
-
10
-
11
-
12
-
13
-
14
-
15
-
16
-
17
-
18
-
19
-
20
-
21
-
22
-
23
-
24
-
25
-
26
-
27
-
28
-
29
-
30
-
31
-
32
-
33
-
34
-
35
-
36
-
37
-
38
-
39
-
40
-
41
-
42
-
43
-
44
-
45
-
46
-
47
-
48
-
49
-
50
-
51
-
52
-
53
-
54
-
55
-
56
-
57
-
58
-
59
-
60
-
61
-
62
-
63
-
64
-
65
-
66
-
67
-
68
-
69
-
70
-
71
-
72
-
73
-
74
-
75
-
76
-
77
-
78
-
79
-
80
-
81
-
 82
82 -
 83
83 -
 84
84 -
 85
85 -
 86
86 -
 87
87 -
 88
88 -
 89
89 -
 90
90 -
 91
91 -
 92
92 -
 93
93 -
 94
94 -
 95
95 -
 96
96 -
 97
97 -
 98
98 -
 99
99 -
 100
100 -
 101
101 -
 102
102 -
103
-
104
-
105
-
106
-
107
-
108
-
109
-
110
-
111
-
112
-
113
-
114
-
115
-
116
-
117
-
118
-
119
-
120
-
121
-
122
-
123
-
124
-
125
-
126
-
127
-
128
-
129
-
130
-
131
-
132
-
133
-
134
-
135
-
136
-
137
-
138
-
139
-
140
-
141
-
142
-
143
-
144
-
145
-
146
-
147
-
148
-
149
-
150
-
151
-
152
-
153
-
154
-
155
-
156
-
157
-
158
-
159
-
160
-
161
-
162
-
163
-
164
-
165
-
166
-
167
-
168
-
169
-
170
-
171
-
172
-
173
-
174
-
175
-
176
-
177
-
178
-
179
-
180
-
181
-
182
-
183
-
184
-
185
-
186
-
187
-
188
-
189
 |
 |

Table of Contents
SEAGATE TECHNOLOGY PLC
NOTES TO CONSOLIDATED FINANCIAL STATEMENTS—(Continued)
At June 29, 2012, the Company had U.S. federal, state and non-U.S. tax net operating loss carryforwards of approximately $2.7 billion,
$1.8 billion and $540 million, respectively, which will expire at various dates beginning in fiscal year 2013, if not utilized. At June 29, 2012, the
Company had U.S. federal and state tax credit carryforwards of $293 million and $70 million, respectively, which will expire at various dates
beginning in fiscal year 2013, if not utilized.
At June 29, 2012, the use of approximately $346 million and $90 million of the Company's U.S. net operating loss and tax credit
carryforwards, respectively, is subject to an aggregate annual limitation of $45 million pursuant to U.S. tax law.
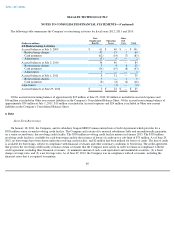
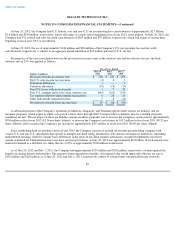
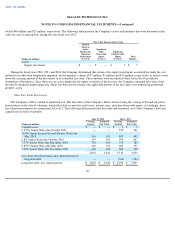
For purposes of the tax reconciliation between the provision for income taxes at the statutory rate and the effective tax rate, the Irish
statutory rate of 25% was applied as follows:
A substantial portion of the Company's operations in Malaysia, Singapore, and Thailand operate under various tax holidays and tax
incentive programs, which expire in whole or in part at various dates through 2020. Certain of the tax holidays may be extended if specific
conditions are met. The net impact of these tax holidays and tax incentive programs was to increase the Company's net income by approximately
$504 million in fiscal year 2012 ($1.14 per share, diluted), to increase the Company's net income by $117 million in fiscal year 2011 ($0.25 per
share, diluted), and to increase the Company's net income by approximately $307 million in fiscal year 2010 ($0.60 per share, diluted).
Since establishing Irish tax residency in fiscal year 2010, the Company consists of an Irish tax resident parent holding company with
various U.S. and non-U.S. subsidiaries that operate in multiple non-Irish taxing jurisdictions. The amount of temporary differences (including
undistributed earnings) related to outside basis differences in the stock of non-Irish resident subsidiaries considered indefinitely reinvested
outside of Ireland for which Irish income taxes have not been provided as of June 29, 2012 was approximately $2.8 billion. If such amount were
remitted to Ireland as a dividend, it is likely that tax at 25% or approximately $700 million would result.
As of June 29, 2012 and July 1, 2011, the Company had approximately $135 million and $128 million, respectively, of unrecognized tax
benefits excluding interest and penalties. The amount of unrecognized tax benefits, if recognized, that would impact the effective tax rate is
$135 million and $128 million as of June 29, 2012 and July 1, 2011, respectively, subject to certain future valuation allowance reversals.
86
Fiscal Years Ended
(Dollars in millions)
June 29,
2012
July 1,
2011
July 2,
2010
Provision (benefit) at statutory rate
$
720
$
145
$
392
Net U.S. state income tax provision
(2
)
2
3
Permanent differences
1
—
2
Valuation allowance
(70
)
(18
)
(77
)
Non
-
U.S. losses with no tax benefits
1
7
31
Non
-
U.S. earnings taxed at less than statutory rate
(645
)
(102
)
(393
)
Tax expense related to intercompany transactions
6
26
26
Other individually immaterial items
9
8
(24
)
Provision for (benefit from) income taxes
$
20
$
68
$
(40
)