Seagate 2011 Annual Report Download - page 56
Download and view the complete annual report
Please find page 56 of the 2011 Seagate annual report below. You can navigate through the pages in the report by either clicking on the pages listed below, or by using the keyword search tool below to find specific information within the annual report.-
 1
1 -
2
-
3
-
4
-
5
-
6
-
7
-
8
-
9
-
10
-
11
-
12
-
13
-
14
-
15
-
16
-
17
-
18
-
19
-
20
-
21
-
22
-
23
-
24
-
25
-
26
-
27
-
28
-
29
-
30
-
31
-
32
-
33
-
34
-
35
-
36
-
37
-
38
-
39
-
40
-
41
-
42
-
43
-
44
-
45
-
 46
46 -
 47
47 -
 48
48 -
 49
49 -
 50
50 -
 51
51 -
 52
52 -
 53
53 -
 54
54 -
 55
55 -
 56
56 -
 57
57 -
 58
58 -
 59
59 -
 60
60 -
 61
61 -
 62
62 -
 63
63 -
 64
64 -
 65
65 -
 66
66 -
67
-
68
-
69
-
70
-
71
-
72
-
73
-
74
-
75
-
76
-
77
-
78
-
79
-
80
-
81
-
82
-
83
-
84
-
85
-
86
-
87
-
88
-
89
-
90
-
91
-
92
-
93
-
94
-
95
-
96
-
97
-
98
-
99
-
100
-
101
-
102
-
103
-
104
-
105
-
106
-
107
-
108
-
109
-
110
-
111
-
112
-
113
-
114
-
115
-
116
-
117
-
118
-
119
-
120
-
121
-
122
-
123
-
124
-
125
-
126
-
127
-
128
-
129
-
130
-
131
-
132
-
133
-
134
-
135
-
136
-
137
-
138
-
139
-
140
-
141
-
142
-
143
-
144
-
145
-
146
-
147
-
148
-
149
-
150
-
151
-
152
-
153
-
154
-
155
-
156
-
157
-
158
-
159
-
160
-
161
-
162
-
163
-
164
-
165
-
166
-
167
-
168
-
169
-
170
-
171
-
172
-
173
-
174
-
175
-
176
-
177
-
178
-
179
-
180
-
181
-
182
-
183
-
184
-
185
-
186
-
187
-
188
-
189
 |
 |

Table of Contents
respectively. As of June 29, 2012, we had $17 million of accrued interest and penalties related to unrecognized tax benefits compared to
$15 million in fiscal year 2011.
During the fiscal year ended June 29, 2012, our unrecognized tax benefits excluding interest and penalties increased by approximately
$7 million primarily due to (i) increases in current year unrecognized tax benefits of $13 million, (ii) net reductions in prior year unrecognized
tax benefits of $2 million, (iii) reductions associated with the expiration of certain statutes of limitation of $3 million, (iv) reductions from other
activity, including non-U.S. exchange gains, of $1 million.
During the 12 months beginning June 30, 2012, we expect to reduce our unrecognized tax benefits by approximately $5 million as a result
of the expiration of certain statutes of limitation. We do not believe it is reasonably possible that other unrecognized tax benefits will materially
change in the next 12 months.
We are subject to taxation in many jurisdictions globally and are required to file U.S. federal, U.S. state, and non-
U.S income tax returns. In
May 2011, the U.S. Internal Revenue Service (IRS) completed its field examination of our U.S. federal income tax returns for fiscal years ending
in 2005 through 2007. The IRS issued a Revenue Agent's Report and proposed certain adjustments. We are currently contesting one of these
proposed adjustments through the IRS Appeals Office. We believe that the resolution of this disputed issue will have no material impact on our
financial statements.
With respect to U.S. state and non-U.S. income tax returns, we are generally no longer subject to tax examinations for years prior to fiscal
year 2004. We are also no longer subject to tax examination of U.S. federal income tax returns for years prior to fiscal year 2005.
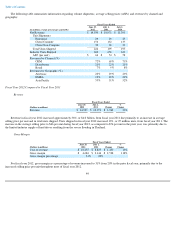
Fiscal Year 2011 Compared to Fiscal Year 2010
Revenue
Revenue in fiscal year 2011 decreased approximately 4%, or $424 million, from fiscal year 2010. Units shipped increased 3% or 6 million
units from fiscal year 2010. This decrease in revenue was due to the cumulative effect of the competitive pricing environment the industry
experienced, partially offset by industry-wide supply constraints.
Sales programs recorded as contra revenue were approximately 8% and 6% of our gross revenue for fiscal years 2011 and 2010,
respectively.
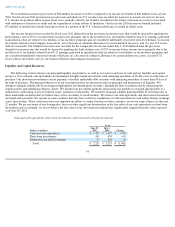
Gross Margin
For fiscal year 2011, gross margin as a percentage of revenue decreased to 20% from 28% in the prior fiscal year, primarily due to price
erosion. In addition, gross margin was negatively impacted by delays in ramping to maturity for new products, which unfavorably affected our
manufacturing yields.
52
Fiscal Years Ended
(Dollars in millions)
July 1,
2011 July 2,
2010 Change %
Change
Revenue
$
10,971
$
11,395
$
(424
)
(4
)%
Fiscal Years Ended
(Dollars in millions)
July 1,
2011
July 2,
2010
Change
%
Change
Cost of revenue
$
8,825
$
8,191
$
634
8
%
Gross margin
$
2,146
$
3,204
$
(1,058
)
(33
)%
Gross margin percentage
20
%
28
%