Seagate 2011 Annual Report Download - page 78
Download and view the complete annual report
Please find page 78 of the 2011 Seagate annual report below. You can navigate through the pages in the report by either clicking on the pages listed below, or by using the keyword search tool below to find specific information within the annual report.-
 1
1 -
2
-
3
-
4
-
5
-
6
-
7
-
8
-
9
-
10
-
11
-
12
-
13
-
14
-
15
-
16
-
17
-
18
-
19
-
20
-
21
-
22
-
23
-
24
-
25
-
26
-
27
-
28
-
29
-
30
-
31
-
32
-
33
-
34
-
35
-
36
-
37
-
38
-
39
-
40
-
41
-
42
-
43
-
44
-
45
-
46
-
47
-
48
-
49
-
50
-
51
-
52
-
53
-
54
-
55
-
56
-
57
-
58
-
59
-
60
-
61
-
62
-
63
-
64
-
65
-
66
-
67
-
 68
68 -
 69
69 -
 70
70 -
 71
71 -
 72
72 -
 73
73 -
 74
74 -
 75
75 -
 76
76 -
 77
77 -
 78
78 -
 79
79 -
 80
80 -
 81
81 -
 82
82 -
 83
83 -
 84
84 -
 85
85 -
 86
86 -
 87
87 -
 88
88 -
89
-
90
-
91
-
92
-
93
-
94
-
95
-
96
-
97
-
98
-
99
-
100
-
101
-
102
-
103
-
104
-
105
-
106
-
107
-
108
-
109
-
110
-
111
-
112
-
113
-
114
-
115
-
116
-
117
-
118
-
119
-
120
-
121
-
122
-
123
-
124
-
125
-
126
-
127
-
128
-
129
-
130
-
131
-
132
-
133
-
134
-
135
-
136
-
137
-
138
-
139
-
140
-
141
-
142
-
143
-
144
-
145
-
146
-
147
-
148
-
149
-
150
-
151
-
152
-
153
-
154
-
155
-
156
-
157
-
158
-
159
-
160
-
161
-
162
-
163
-
164
-
165
-
166
-
167
-
168
-
169
-
170
-
171
-
172
-
173
-
174
-
175
-
176
-
177
-
178
-
179
-
180
-
181
-
182
-
183
-
184
-
185
-
186
-
187
-
188
-
189
 |
 |

Table of Contents
SEAGATE TECHNOLOGY PLC
NOTES TO CONSOLIDATED FINANCIAL STATEMENTS—(Continued)
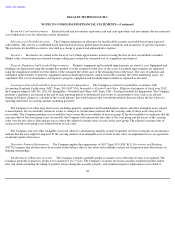
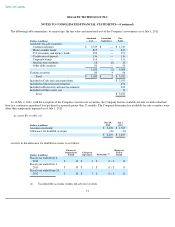
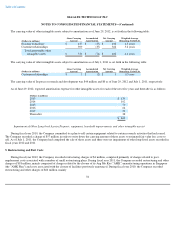
The following table summarizes, by major type, the fair value and amortized cost of the Company's investments as of June 29, 2012:
As of June 29, 2012, with the exception of the Company's auction rate securities, the Company had no available-for-sale securities that had
been in a continuous unrealized loss position for a period greater than 12 months. The Company determined no available-for-
sale securities were
other-than-temporarily impaired as of June 29, 2012.
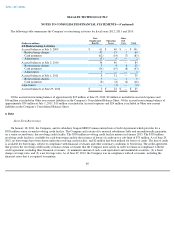
The fair value of the Company's investments classified as available-for-sale at June 29, 2012 by remaining contractual maturity was as
follows:
72
(Dollars in millions)
Amortized
Cost
Unrealized
Gain/(Loss)
Fair
Value
Available
-
for
-
sale securities:
Money market funds
$
1,158
$
—
$
1,158
Commercial paper
393
—
393
Corporate bonds
208
1
209
U.S. treasuries and agency bonds
98
1
99
Certificates of deposit
6
—
6
Auction rate securities
17
(2
)
15
Other debt securities
99
(1
)
98
1,979
(1
)
1,978
Trading securities
73
—
73
Total
$
2,052
$
(1
)
$
2,051
Included in Cash and cash equivalents
$
1,532
Included in Short
-
term investments
411
Included in Restricted cash and investments
93
Included in Other assets, net
15
Total
$
2,051
(Dollars in millions)
Amortized
Cost Fair
Value
Due in less than 1 year
$
1,615
$
1,615
Due in 1 to 5 years
347
348
Thereafter
17
15
Total
$
1,979
$
1,978