Seagate 2011 Annual Report Download - page 108
Download and view the complete annual report
Please find page 108 of the 2011 Seagate annual report below. You can navigate through the pages in the report by either clicking on the pages listed below, or by using the keyword search tool below to find specific information within the annual report.-
 1
1 -
2
-
3
-
4
-
5
-
6
-
7
-
8
-
9
-
10
-
11
-
12
-
13
-
14
-
15
-
16
-
17
-
18
-
19
-
20
-
21
-
22
-
23
-
24
-
25
-
26
-
27
-
28
-
29
-
30
-
31
-
32
-
33
-
34
-
35
-
36
-
37
-
38
-
39
-
40
-
41
-
42
-
43
-
44
-
45
-
46
-
47
-
48
-
49
-
50
-
51
-
52
-
53
-
54
-
55
-
56
-
57
-
58
-
59
-
60
-
61
-
62
-
63
-
64
-
65
-
66
-
67
-
68
-
69
-
70
-
71
-
72
-
73
-
74
-
75
-
76
-
77
-
78
-
79
-
80
-
81
-
82
-
83
-
84
-
85
-
86
-
87
-
88
-
89
-
90
-
91
-
92
-
93
-
94
-
95
-
96
-
97
-
 98
98 -
 99
99 -
 100
100 -
 101
101 -
 102
102 -
 103
103 -
 104
104 -
 105
105 -
 106
106 -
 107
107 -
 108
108 -
 109
109 -
 110
110 -
 111
111 -
 112
112 -
 113
113 -
 114
114 -
 115
115 -
 116
116 -
 117
117 -
 118
118 -
119
-
120
-
121
-
122
-
123
-
124
-
125
-
126
-
127
-
128
-
129
-
130
-
131
-
132
-
133
-
134
-
135
-
136
-
137
-
138
-
139
-
140
-
141
-
142
-
143
-
144
-
145
-
146
-
147
-
148
-
149
-
150
-
151
-
152
-
153
-
154
-
155
-
156
-
157
-
158
-
159
-
160
-
161
-
162
-
163
-
164
-
165
-
166
-
167
-
168
-
169
-
170
-
171
-
172
-
173
-
174
-
175
-
176
-
177
-
178
-
179
-
180
-
181
-
182
-
183
-
184
-
185
-
186
-
187
-
188
-
189
 |
 |

Table of Contents
SEAGATE TECHNOLOGY PLC
NOTES TO CONSOLIDATED FINANCIAL STATEMENTS—(Continued)
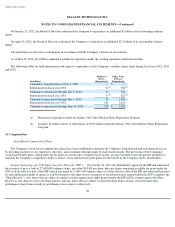
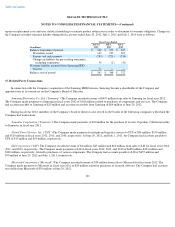
Stock Option Activity
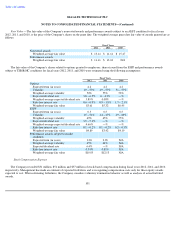
The Company issues new ordinary shares upon exercise of stock options. The following is a summary of option activities:
The aggregate intrinsic value is calculated as the difference between the exercise price of the underlying awards and the quoted price of the
Company's ordinary shares for the options that were in-the-money at June 29, 2012. During fiscal years 2012, 2011, and 2010, the aggregate
intrinsic value of options exercised under the Company's stock option plans was $245 million, $76 million and $41 million, respectively,
determined as of the date of option exercise. The aggregate fair value of options vested during fiscal year 2012 was approximately $17 million.
At June 29, 2012, the total compensation cost related to options granted to employees but not yet recognized was approximately
$20 million, net of estimated forfeitures of approximately $1 million. This cost is being amortized on a straight-line basis over a weighted-
average remaining term of approximately 2.4 years and will be adjusted for subsequent changes in estimated forfeitures.
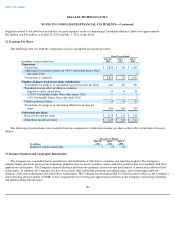
Nonvested Awards Activity
The following is a summary of nonvested award activities:
At June 29, 2012, the total compensation cost related to nonvested awards granted to employees but not yet recognized was approximately
$36 million, net of estimated forfeitures of approximately $3 million. This cost is being amortized on a straight-line basis over a weighted-
average remaining term of 2.9 years
102
Options Number of
Shares
Weighted-
Average
Exercise
Price
Weighted-
Average
Remaining
Contractual
Term
Aggregate
Intrinsic
Value
(In millions)
(In years)
(Dollars In millions)
Outstanding at July 1, 2011
46.4
$
13.44
3.3
$
259
Granted
2.0
13.56
Exercised
(23.0
)
13.49
Forfeitures
(0.7
)
6.02
Expirations
(2.1
)
18.09
Outstanding at June 29, 2012
22.6
$
13.18
3.3
$
264
Vested and expected to vest at June 29,
2012
21.7
$
13.39
3.2
$
250
Exercisable at June 29, 2012
14.2
$
16.10
2.4
$
126
Nonvested Awards
Number of
Shares
Weighted
-
Average
Grant-
Date
Fair Value
(In millions)
Nonvested at July 1, 2011
2.5
$
12.05
Granted
2.5
$
13.14
Forfeitures
(0.2
)
$
11.70
Vested
(0.8
)
$
12.77
Nonvested at June 29, 2012
4.0
$
12.62