Seagate 2011 Annual Report Download - page 54
Download and view the complete annual report
Please find page 54 of the 2011 Seagate annual report below. You can navigate through the pages in the report by either clicking on the pages listed below, or by using the keyword search tool below to find specific information within the annual report.-
 1
1 -
2
-
3
-
4
-
5
-
6
-
7
-
8
-
9
-
10
-
11
-
12
-
13
-
14
-
15
-
16
-
17
-
18
-
19
-
20
-
21
-
22
-
23
-
24
-
25
-
26
-
27
-
28
-
29
-
30
-
31
-
32
-
33
-
34
-
35
-
36
-
37
-
38
-
39
-
40
-
41
-
42
-
43
-
 44
44 -
 45
45 -
 46
46 -
 47
47 -
 48
48 -
 49
49 -
 50
50 -
 51
51 -
 52
52 -
 53
53 -
 54
54 -
 55
55 -
 56
56 -
 57
57 -
 58
58 -
 59
59 -
 60
60 -
 61
61 -
 62
62 -
 63
63 -
 64
64 -
65
-
66
-
67
-
68
-
69
-
70
-
71
-
72
-
73
-
74
-
75
-
76
-
77
-
78
-
79
-
80
-
81
-
82
-
83
-
84
-
85
-
86
-
87
-
88
-
89
-
90
-
91
-
92
-
93
-
94
-
95
-
96
-
97
-
98
-
99
-
100
-
101
-
102
-
103
-
104
-
105
-
106
-
107
-
108
-
109
-
110
-
111
-
112
-
113
-
114
-
115
-
116
-
117
-
118
-
119
-
120
-
121
-
122
-
123
-
124
-
125
-
126
-
127
-
128
-
129
-
130
-
131
-
132
-
133
-
134
-
135
-
136
-
137
-
138
-
139
-
140
-
141
-
142
-
143
-
144
-
145
-
146
-
147
-
148
-
149
-
150
-
151
-
152
-
153
-
154
-
155
-
156
-
157
-
158
-
159
-
160
-
161
-
162
-
163
-
164
-
165
-
166
-
167
-
168
-
169
-
170
-
171
-
172
-
173
-
174
-
175
-
176
-
177
-
178
-
179
-
180
-
181
-
182
-
183
-
184
-
185
-
186
-
187
-
188
-
189
 |
 |

Table of Contents
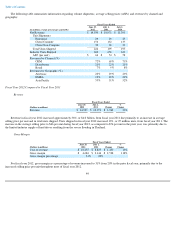
Operating Expenses
Product Development Expense. Product development expenses for fiscal year 2012 increased from fiscal year 2011, primarily reflecting
an increase in variable performance-based compensation and the integration of the HDD business acquired from Samsung.
Marketing and Administrative Expense. The increase in Marketing and administrative expenses for fiscal year 2012 compared to fiscal
year 2011 was primarily due to an increase in variable performance
-based compensation and integration of the HDD business acquired from
Samsung.
Amortization of Intangibles. Amortization of intangibles for fiscal year 2012 increased as a result of the acquisition of certain intangible
assets from Samsung's HDD business.
Restructuring and Other, net. Restructuring and other, net for fiscal years 2012 and 2011, were not material and primarily related to
previously announced restructuring plans.
Other Income (Expense), net
Other expense, net for fiscal year 2012 compared to fiscal year 2011 was relatively flat, and included an increase in interest expense
resulting from higher average debt balances, substantially offset by gains on foreign currency remeasurement.
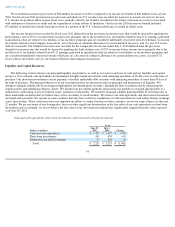
Income Taxes
We recorded an income tax provision of $20 million for fiscal year 2012 compared to an income tax provision of $68 million for fiscal year
2011. Our fiscal year 2012 provision for income taxes included $35 million of income tax benefit from the reversal of a portion of the U.S.
valuation allowance recorded in prior periods. Our fiscal year 2011 provision for income taxes included non-U.S. income taxes recorded for
increases in income tax reserves for non-U.S. income tax positions taken in prior fiscal years, partially offset by tax benefits recorded for the
release of income tax reserves associated with settlements of income tax audits and the expiration of certain statutes of limitation.
Our Irish tax resident parent holding company owns various U.S. and non-U.S. subsidiaries that operate in multiple non-Irish tax
jurisdictions. Our worldwide operating income is either subject to varying
50
Fiscal Years Ended
(Dollars in millions)
June 29,
2012
July 1,
2011
Change
%
Change
Product development
$
1,006
$
875
$
131
15
%
Marketing and administrative
528
445
83
19
%
Amortization of intangibles
38
2
36
1,800
%
Restructuring and other, net
4
18
(14
)
(78
)%
Operating expenses
$
1,576
$
1,340
$
236
Fiscal Years Ended
(Dollars in millions)
June 29,
2012 July 1,
2011 Change %
Change
Other expense, net
$
(226
)
$
(227
)
$
1
—
%
Fiscal Years Ended
(Dollars in millions)
June 29,
2012 July 1,
2011 Change %
Change
Provision for (benefit from) income
taxes
$
20
$
68
$
(48
)
(71
)%