Seagate 2011 Annual Report Download - page 64
Download and view the complete annual report
Please find page 64 of the 2011 Seagate annual report below. You can navigate through the pages in the report by either clicking on the pages listed below, or by using the keyword search tool below to find specific information within the annual report.-
 1
1 -
2
-
3
-
4
-
5
-
6
-
7
-
8
-
9
-
10
-
11
-
12
-
13
-
14
-
15
-
16
-
17
-
18
-
19
-
20
-
21
-
22
-
23
-
24
-
25
-
26
-
27
-
28
-
29
-
30
-
31
-
32
-
33
-
34
-
35
-
36
-
37
-
38
-
39
-
40
-
41
-
42
-
43
-
44
-
45
-
46
-
47
-
48
-
49
-
50
-
51
-
52
-
53
-
 54
54 -
 55
55 -
 56
56 -
 57
57 -
 58
58 -
 59
59 -
 60
60 -
 61
61 -
 62
62 -
 63
63 -
 64
64 -
 65
65 -
 66
66 -
 67
67 -
 68
68 -
 69
69 -
 70
70 -
 71
71 -
 72
72 -
 73
73 -
 74
74 -
75
-
76
-
77
-
78
-
79
-
80
-
81
-
82
-
83
-
84
-
85
-
86
-
87
-
88
-
89
-
90
-
91
-
92
-
93
-
94
-
95
-
96
-
97
-
98
-
99
-
100
-
101
-
102
-
103
-
104
-
105
-
106
-
107
-
108
-
109
-
110
-
111
-
112
-
113
-
114
-
115
-
116
-
117
-
118
-
119
-
120
-
121
-
122
-
123
-
124
-
125
-
126
-
127
-
128
-
129
-
130
-
131
-
132
-
133
-
134
-
135
-
136
-
137
-
138
-
139
-
140
-
141
-
142
-
143
-
144
-
145
-
146
-
147
-
148
-
149
-
150
-
151
-
152
-
153
-
154
-
155
-
156
-
157
-
158
-
159
-
160
-
161
-
162
-
163
-
164
-
165
-
166
-
167
-
168
-
169
-
170
-
171
-
172
-
173
-
174
-
175
-
176
-
177
-
178
-
179
-
180
-
181
-
182
-
183
-
184
-
185
-
186
-
187
-
188
-
189
 |
 |

Table of Contents
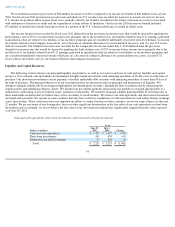
1.8% respectively, for the same periods. Changes in anticipated failure rates of specific products and significant changes in repair or replacement
costs have historically been the major reasons for significant changes in prior estimates. Any future changes in failure rates of certain products,
as well as changes in repair costs or the cost of replacement parts, may result in increased or decreased warranty accruals.
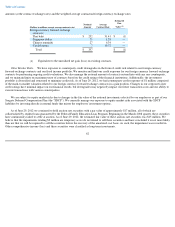
Accounting for Income Taxes.
We account for income taxes pursuant to Accounting Standards Codification (ASC) Topic 740 (ASC 740),
Income Taxes. In applying ASC 740, we make certain estimates and judgments in determining income tax expense for financial statement
purposes. These estimates and judgments occur in the calculation of tax credits, recognition of income and deductions and calculation of specific
tax assets and liabilities, which arise from differences in the timing of recognition of revenue and expense for tax and financial statement
purposes, as well as tax liabilities associated with uncertain tax positions. The calculation of tax liabilities involves uncertainties in the
application of complex tax rules and the potential for future adjustment of our uncertain tax positions by the Internal Revenue Service or other
tax jurisdictions. If estimates of these tax liabilities are greater or less than actual results, an additional tax benefit or provision will result. The
deferred tax assets we record each period depend primarily on our ability to generate future taxable income in the United States and certain non-
U.S. jurisdictions. Each period, we evaluate the need for a valuation allowance for our deferred tax assets and, if necessary, we adjust the
valuation allowance so that net deferred tax assets are recorded only to the extent we conclude it is more likely than not that these deferred tax
assets will be realized. If our outlook for future taxable income changes significantly, our assessment of the need for a valuation allowance may
also change.
Assessing Goodwill and Other Long-lived Assets for Impairment. We account for goodwill in accordance with ASC 350, Intangibles—
Goodwill and Other . As required by ASC 350, we perform a qualitative assessment in determining whether the existence of events or
circumstances leads to a determination that it is more likely than not that the fair value of a reporting unit is less than its carrying amount. Based
on the qualitative assessment, if it is not more likely than not that the fair value of a reporting unit is less than its carrying amount, then the
Company is not required to perform the two-step goodwill impairment test.
In accordance with ASC 360-05-4, Impairment or Disposal of Long-lived Assets , we test other long-lived assets, including property,
equipment and leasehold improvements and other intangible assets subject to amortization, for recoverability whenever events or changes in
circumstances indicate that the carrying values of those assets may not be recoverable. We assess the recoverability of an asset group by
determining if the carrying value of the asset group exceeds the sum of the projected undiscounted cash flows expected to result from the use and
eventual disposition of the assets over the remaining economic life of the primary asset in the asset group. If the recoverability test indicates that
the carrying value of the asset group is not recoverable, we will estimate the fair value of the asset group using the same approaches indicated
above for ASC 360 step two and compare it to its carrying value. The excess of the carrying value over the fair value is allocated pro rata to
derive the adjusted carrying value of each asset in the asset group. The adjusted carrying value of each asset in the asset group is not reduced
below its fair value.
Recent Accounting Pronouncements
See "Item 8. Financial Statements and Supplementary Data, Note 1. Basis of Presentation and Summary of Significant Accounting Policies"
for information regarding the effect of new accounting pronouncements on our financial statements.
ITEM 7A. QUANTITATIVE AND QUALITATIVE DISCLOSURES ABOUT MARKET RISK
We have exposure to market risks due to the volatility of interest rates, foreign currency exchange rates, equity and bond markets. A portion
of these risks are hedged, but fluctuations could impact our results of operations, financial position and cash flows. Additionally, we have
exposure to downgrades in the credit ratings of our counterparties as well as exposure related to our credit rating changes.
60