Seagate 2011 Annual Report Download - page 107
Download and view the complete annual report
Please find page 107 of the 2011 Seagate annual report below. You can navigate through the pages in the report by either clicking on the pages listed below, or by using the keyword search tool below to find specific information within the annual report.-
 1
1 -
2
-
3
-
4
-
5
-
6
-
7
-
8
-
9
-
10
-
11
-
12
-
13
-
14
-
15
-
16
-
17
-
18
-
19
-
20
-
21
-
22
-
23
-
24
-
25
-
26
-
27
-
28
-
29
-
30
-
31
-
32
-
33
-
34
-
35
-
36
-
37
-
38
-
39
-
40
-
41
-
42
-
43
-
44
-
45
-
46
-
47
-
48
-
49
-
50
-
51
-
52
-
53
-
54
-
55
-
56
-
57
-
58
-
59
-
60
-
61
-
62
-
63
-
64
-
65
-
66
-
67
-
68
-
69
-
70
-
71
-
72
-
73
-
74
-
75
-
76
-
77
-
78
-
79
-
80
-
81
-
82
-
83
-
84
-
85
-
86
-
87
-
88
-
89
-
90
-
91
-
92
-
93
-
94
-
95
-
96
-
 97
97 -
 98
98 -
 99
99 -
 100
100 -
 101
101 -
 102
102 -
 103
103 -
 104
104 -
 105
105 -
 106
106 -
 107
107 -
 108
108 -
 109
109 -
 110
110 -
 111
111 -
 112
112 -
 113
113 -
 114
114 -
 115
115 -
 116
116 -
 117
117 -
118
-
119
-
120
-
121
-
122
-
123
-
124
-
125
-
126
-
127
-
128
-
129
-
130
-
131
-
132
-
133
-
134
-
135
-
136
-
137
-
138
-
139
-
140
-
141
-
142
-
143
-
144
-
145
-
146
-
147
-
148
-
149
-
150
-
151
-
152
-
153
-
154
-
155
-
156
-
157
-
158
-
159
-
160
-
161
-
162
-
163
-
164
-
165
-
166
-
167
-
168
-
169
-
170
-
171
-
172
-
173
-
174
-
175
-
176
-
177
-
178
-
179
-
180
-
181
-
182
-
183
-
184
-
185
-
186
-
187
-
188
-
189
 |
 |

Table of Contents
SEAGATE TECHNOLOGY PLC
NOTES TO CONSOLIDATED FINANCIAL STATEMENTS—(Continued)
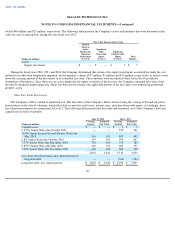
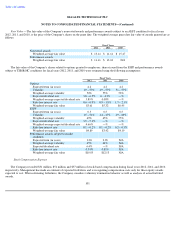
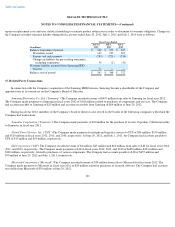
Fair Value —The fair value of the Company's nonvested awards and performance awards subject to an AEPS condition for fiscal years
2012, 2011, and 2010, is the price of the Company's shares on the grant date. The weighted average grant date fair value of awards granted are as
follows:
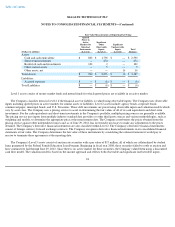
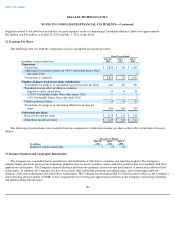
The fair value of the Company's shares related to options granted to employees, shares issued from the ESPP and performance awards
subject to TSR/ROIC conditions for fiscal years 2012, 2011, and 2010 were estimated using the following assumptions:
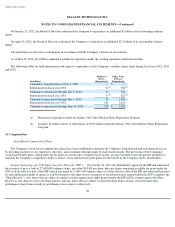
Stock Compensation Expense
The Company recorded $51 million, $51 million and $57 million of stock-based compensation during fiscal years 2012, 2011, and 2010,
respectively. Management has made an estimate of expected forfeitures and is recognizing compensation costs only for those equity awards
expected to vest. When estimating forfeitures, the Company considers voluntary termination behavior as well as analysis of actual forfeited
awards.
101
Fiscal Years
2012
2011
2010
Nonvested awards
Weighted
-
average fair value
$
13.14
$
11.61
$
15.47
Performance awards
Weighted
-
average fair value
$
11.16
$
13.63
N/A
Fiscal Years
2012
2011
2010
Options
Expected term (in years)
4.2
4.2
4.2
Volatility
49
–
53%
49
–
57%
51
–
57%
Weighted
-
average volatility
50%
55%
53%
Expected dividend rate
3.8
–
6.5%
0
–
4.3%
—
%
Weighted
-
average expected dividend rate
5.89%
0.08%
—
%
Risk
-
free interest rate
0.6
–
0.9%
0.9
–
1.8%
1.7
–
2.1%
Weighted
-
average fair value
$3.61
$5.32
$6.45
ESPP
Expected term (in years)
0.5
0.5
0.5
Volatility
45
–
54%
44
–
47%
49
–
60%
Weighted
-
average volatility
49%
45%
55%
Expected dividend rate
3.9
–
5.2%
—
%
—
%
Weighted
-
average expected dividend rate
4.66%
—
%
—
%
Risk
-
free interest rate
0.1
–
0.2%
0.1
–
0.2%
0.2
–
0.3%
Weighted
-
average fair value
$4.89
$3.42
$4.19
Performance awards subject to market
condition
Expected term (in years)
2.96
2.96
N/A
Weighted
-
average volatility
65%
64%
N/A
Expected dividend rate
6.4%
—
%
N/A
Risk
-
free interest rate
0.34%
0.81%
N/A
Weighted
-
average fair value
$10.05
$12.13
N/A